This is the multi-page printable view of this section.
Click here to print.
Return to the regular view of this page.
Documentation
- 1: A
- 2: B
- 3: C
- 4: D
- 5: E
- 6: F
- 7: G
- 8: H
- 9: I
- 10: J
- 11: K
- 12: L
- 13: M
- 14: N
- 15: O
- 16: P
- 17: Q
- 18: R
- 19: S
- 20: T
- 21: U
- 22: V
- 23: W
- 24: X
- 25: Y
- 26: Z
An introduction to the A-Z of Cloud
An initiative by the Cloud Computing Core Team at Google Developer Student Clubs, Veermata Jijabai Technological Insitute, A-Z Cloud exposes you to 26 concepts and related cloud technologies from A-Z.
Concepts like Automation, Big Data and more are covered with related cloud tech that begin with the same letter.
Many services of Google Cloud Platform are mentioned with each concept. To get hands-on practice, the revelant codelaba on Google Cloud Skills Boost are provided with each article.
1 - A
Automation
The rule of the cloud is to ruthlessly automate everything
- Patrick Gelsinger, CEO Intel, ex-CEO VMWare
Apart from taking advantage of compute resources, such as a remote server or a database, cloud computing in its essence deals with automation of the software delivery process. The following are the 3 steps that are automated in this delivery process:
Application Development
There are several tasks that a developer would like to include in their development workflow such as running unit tests, deploying the application on each new change, let’s say this change is making a new commit to a GitHub repository. Such repetitive tasks can be automated on GitHub with the help of Actions.
Deployment Configuration
Say you are building a Python or a Node.js web application. What software does your local machine need to run this project? Let’s start from the basics, an operating system. Node.js or the Python interpreter to run the scripts that you’ll write, npm or pip to install and manage the required dependencies and so on. Now what if you have to deploy this application, say on Heroku or Google App Engine. You only provide the source code and the list of dependencies to it. However, behind the scenes, there are a lot more configurations that are done for you. Such as the choice of the machine/server on which your code will run, the operating system it will run on, etc. All of this is part of deployment configuration which is automated for you. As a developer, you only provide the code and the platform does the configurations for you.
This concept can also be extended to Infrastructure-as-Code. What if you want to specify the kind of machine your code should run on, the operating system that your code runs on, the version of Python or Node.js runtime that you need? With this, you have a lot more configurations to be done on your own. For big companies, with many such applications deployed, imagine how many such configurations they have to specify for each deployment? In order to automate configurations for Infrastructure-as-Code, many cloud technologies are available today, namely Ansible, Puppet, Chef.
Scaling
Imagine you have built a web application deployed using some cloud service and is accessed by hundreds of users every week. Let’s say it is your personal blog. One of your stories becomes a major hit and now you get thousands of users visitng your website, interacting with it. We can say that now there is an increased load on your website. How will you deal with this? This additional load can be carried out by autoscaling which is provided out of the box by most cloud platforms providing compute resources. By autoscaling, the number of servers or virtual machines running on a single server can be scaled as per the load without requiring any manual intervention.
1.1 - Actions by GitHub
Automate your development process with GitHub Actions
To quickly see GitHub Actions in action, check out the .github directory in the source code of this website here. You can see the following directory structure:
.github
├── dependabot.yml
└── workflows
    └── gh-pages.yaml
There is a .yaml or YAML (which stands for YAML Ain’t Markup Language) file that defines some workflow or a set of tasks that will be run on each event on the GitHub repository.
What is an event?
An event is a specific change made to your GitHub repository that should trigger your desired workflow. This event can be a new push, a new issue or a pull request made to the repository.
What is a workflow?
A set of automated tasks that are to be run of a specific event. A workflow is composed of several jobs and is defined in a YAML file such as specified above with gh-pages.yaml. This is how this file looks:
name: GitHub Pages

on:
  push:
    branches:
      - main # Set a branch to deploy
  pull_request:

jobs:
  deploy:
    runs-on: ubuntu-20.04
    concurrency:
      group: ${{ github.workflow }}-${{ github.ref }}
    steps:
      - uses: actions/checkout@v3
        with:
          submodules: true # Fetch Hugo themes (true OR recursive)
          fetch-depth: 1 # Fetch all history for .GitInfo and .Lastmod

      - name: Setup Hugo
        uses: peaceiris/actions-hugo@v2
        with:
          hugo-version: "latest"
          extended: true

      - name: Build
        run: git submodule update --init --recursive --depth 1 && npm i && hugo

      - name: Deploy
        uses: peaceiris/actions-gh-pages@v3
        if: ${{ github.ref == 'refs/heads/main' }}
        with:
          github_token: ${{ secrets.GITHUB_TOKEN }}
          publish_dir: ./public
There are 2 keywords to focus on in this file - on and jobs. on is where you define the event/s that should trigger this workflow and jobs are the set of tasks that should execute as a part of the workflow.
Learn
GitHub Actions is a powerful tool to have in your development arsenal. Learn more from the official documentation.
1.2 - App Engine by Google Cloud Platform
Deployment configuration and more with Google App Engine
A fully managed environment lets you focus on code while App Engine manages infrastructure concerns.
Google App Engine is a Platform-as-a-Service for deploying and managing web applications for Go, PHP, Python, Ruby, .NET, and Node.js runtimes along with custom runtimes. It offers autoscaling, cloud monitoring and logging services with the ability to define access rules for your web application.
Learn
Try out App Engine by deploying a Flask web application with this codelab!
2 - B
Big Data
The world is one big data problem.
- Andrew McAfee, co-director of the MIT Initiative
Big data is a term that describes large, hard-to-manage volumes of data – both structured and unstructured – that inundate businesses on a day-to-day basis.
Examples
Following are a few examples of big data databases, just to give y’all an idea of how big this could be:
-
The New York Stock Exchange is an example of Big Data that generates about one terabyte ( 10^12 bytes ◉‿◉) of new trade data per day.
-
A single Jet engine can generate 10+ terabytes of data in 30 minutes of flight time. With many thousand flights per day, generation of data reaches up to many Petabytes.

Why is Big Data Important?
The importance of big data doesn’t simply revolve around how much data you have. The value lies in how you use it. By taking data from any source and analyzing it, you can find answers that
- streamline resource management
- improve operational efficiencies
- optimize product development
- drive new revenue and growth opportunities
- enable smart decision making.
When you combine big data with high-performance analytics provided by Google Cloud services, you can accomplish business-related tasks such as:
- Determining root causes of failures, issues and defects in near-real time.
- Spotting anomalies faster and more accurately than the human eye.
- Improving patient outcomes by rapidly converting medical image data into insights.
- Recalculating entire risk portfolios in minutes.
- Sharpening deep learning models’ ability to accurately classify and react to changing variables.
- Detecting fraudulent behavior before it affects your organization.
How Google Cloud services helps?
Google Cloud Platform provides a bunch of different services, which cover all popular needs of data and Big Data applications.
We would be discussing two critical services i.e. BigQuery and BigTable here.
2.1 - BigQuery
Analyse your Big Data with fast and reliable BigQuery Analytics.
BigQuery’s serverless infrastructure lets you focus on your data instead of resource management. BigQuery combines a cloud-based data warehouse and powerful analytic tools.
BigQuery storage
-
BigQuery stores data using a columnar storage format that is optimized for analytical queries.
-
BigQuery presents data in tables, rows, and columns and provides full support for database transaction semantics (ACID).
-
BigQuery storage is automatically replicated across multiple locations to provide high availability.
BigQuery analytics
-
Descriptive and prescriptive analysis uses include business intelligence, ad hoc analysis, geospatial analytics, and machine learning.
-
You can query data stored in BigQuery or run queries on data where it lives using external tables or federated queries including Cloud Storage, Bigtable, Spanner, or Google Sheets stored in Google Drive.
Learn
Learn more from the official documentation.
2.2 - BigTable
Store your Big Data in fast and highly scalable BigTable storage services.
Cloud Bigtable is a sparsely populated table that can scale to billions of rows and thousands of columns, enabling you to store terabytes or even petabytes of data. A single value in each row is indexed; this value is known as the row key. Bigtable is ideal for storing very large amounts of single-keyed data with very low latency. It supports high read and write throughput at low latency, and it is an ideal data source for MapReduce operations.
Bigtable is exposed to applications through multiple client libraries, including a supported extension to the Apache HBase library for Java. As a result, it integrates with the existing Apache ecosystem of open-source Big Data software.
Bigtable’s powerful back-end servers offer several key advantages over a self-managed HBase installation:
- Incredible scalability Bigtable scales in direct proportion to the number of machines in your cluster. A self-managed HBase installation has a design bottleneck that limits the performance after a certain threshold is reached. Bigtable does not have this bottleneck, so you can scale your cluster up to handle more reads and writes.
- Simple administration Bigtable handles upgrades and restarts transparently, and it automatically maintains high data durability. To replicate your data, simply add a second cluster to your instance, and replication starts automatically. No more managing replicas or regions; just design your table schemas, and Bigtable will handle the rest for you.
- Cluster resizing without downtime You can increase the size of a Bigtable cluster for a few hours to handle a large load, then reduce the cluster’s size again—all without any downtime. After you change a cluster’s size, it typically takes just a few minutes under load for Bigtable to balance performance across all of the nodes in your cluster.
Learn
Learn more from the official documentation.
3 - C
Continuous Integration and Continuous Delivery (CI/CD)
As cloud native approaches gather steam, CI/CD practices have to evolve to maintain stability as you increase speed. Because without the right guard rails, it’s like attaching a rocket ship to a go kart. It’s not a very fun ride.
- Ravi Tharisayi, ex-Team Lead and Principal Advisor at IBM
Continuous Integration (CI) and Continuous Delivery (CD) embody a culture, set of operating principles, and collection of practices that enable application development teams to deliver code changes more frequently and reliably. The implementation is also known as the CI/CD pipeline.
CI/CD tools help store the environment-specific parameters that must be packaged with each delivery. CI/CD automation then performs any necessary service calls to web servers, databases, and other services that may need to be restarted or follow other procedures when applications are deployed.
Continuous Integration
It is a coding philosophy and set of practices that drive development teams to implement small changes and check in code to version control repositories frequently. Because most modern applications require developing code in different platforms and tools, the team needs a mechanism to integrate and validate its changes.
The technical goal of CI is to establish a consistent and automated way to build, package, and test applications. With consistency in the integration process in place, teams are more likely to commit code changes more frequently, which leads to better collaboration and software quality.
Continuous Delivery
CD picks up where continuous integration ends. CD automates the delivery of applications to selected infrastructure environments. Most teams work with multiple environments other than the production, such as development and testing environments, and CD ensures there is an automated way to push code changes to them.
A typical CD pipeline has build, test, and deploy stages. More sophisticated pipelines include many of these steps:
- Pulling code from version control and executing a build.
- Executing any required infrastructure steps that are automated as code to stand up or tear down cloud infrastructure.
- Moving code to the target computing environment.
- Managing the environment variables and configuring them for the target environment.
- Pushing application components to their appropriate services, such as web servers, API services, and database services.
- Executing any steps required to restarts services or call service endpoints that are needed for new code pushes.
- Executing continuous tests and rollback environments if tests fail.
- Providing log data and alerts on the state of the delivery
Implementing CI/CD pipelines with Kubernetes and serverless architectures
Many teams operating CI/CD pipelines in cloud environments also use containers such as Docker and orchestration systems such as Kubernetes. Containers allow for packaging and shipping applications in standard, portable ways. Containers make it easy to scale up or tear down environments that have variable workloads.
There are many approaches to using containers, infrastructure as code, and CI/CD pipelines together. You can explore options such as Kubernetes with Jenkins or Kubernetes with Azure DevOps.
Serverless computing architectures present another avenue for deploying and scaling applications. In a serverless environment, the infrastructure is fully managed by the cloud service provider and the application consumes resources as needed based on its configuration.
3.1 - Cloud Build by Google Cloud Platform
Use GCP Cloud Build to build, test and deploy container images.
Implementing containerization has inspired organizations to maximize managed cloud infrastructures like Cloud Build to speedily build, test and deploy container images.
Cloud Build is a service that executes your builds on Google Cloud.
Cloud Build can import source code from a variety of repositories or cloud storage spaces, execute a build to your specifications, and produce artifacts such as Docker containers or Java archives.
Learn
Learn more about Cloud build in GCP from the official documentation.
Try out Continuous deployment to Google Kubernetes Engine (GKE) with Cloud Build from this codelab
3.2 - Containers
About Containers and their uses.
Containers are lightweight packages of your application code together with dependencies such as specific versions of programming language runtimes and libraries required to run your software services.
What are containers?
Containers are packages of software that contain all of the necessary elements to run in any environment. In this way, containers virtualize the operating system and run anywhere, from a private data center to the public cloud or even on a developer’s personal laptop. From Gmail to YouTube to Search, everything at Google runs in containers. Containerization allows our development teams to move fast, deploy software efficiently, and operate at an unprecedented scale.
What are containers used for?
Containers offer a logical packaging mechanism in which applications can be abstracted from the environment in which they actually run. This decoupling allows container-based applications to be deployed easily and consistently, regardless of whether the target environment is a private data center, the public cloud, or even a developer’s personal laptop.
-
Microservices:
Containers are small and lightweight, which makes them a good match for microservice architectures where applications are constructed of many, loosely coupled and independently deployable smaller services.
-
DevOps:
The combination of microservices as an architecture and containers as a platform is a common foundation for many teams that embrace DevOps as the way they build, ship and run software.
-
Hybrid, multi-cloud:
Because containers can run consistently anywhere, across laptop, on-premises and cloud environments, they are an ideal underlying architecture for hybrid cloud and multicloud scenarios where organizations find themselves operating across a mix of multiple public clouds in combination with their own data center.
-
Application modernizing and migration:
One of the most common approaches to application modernization starts by containerizing them so that they can be migrated to the cloud.
4 - D
DevOps
DevOps is not a goal, but a never-ending process of continual improvement
- Jez Humble, Site Reliability Engineering at Google Cloud, co-author of The DevOps Handbook
Before attempting to define DevOps, let’s first make it clear - Dev means software development and Ops means operations required to ship and maintain this software.
DevOps is an approach to bring both, the development and the operations cycles together. As student developers, we are usually on the developer cycle - plan a new feature, build it, push it - deployment and similar operations usually come last. However, DevOps advocates for practices wherein each new development in the software is followed by a series of steps such as configuration, deployment, monitoring, quality assurance, and a lot more.

But why do such operations need to be coupled with the development cycle? To increase velocity of delivering new features of a project with CI/CD and automation. Companies like Google and Meta make more than 10000 production pushes in a day across services; this is made possible by adopting DevOps practices, for e.g. according to this talk in 2018, Amazon makes a production push every 11.6 seconds! It also helps to create reliable applications, for example, if you detect an issue or bug in production, a minimal change can be quickly reflected if you have a CI/CD pipeline in place.
How do we implement the DevOps cycle? For the operations cycle to be integrated with software development, there need to be technologies that allow us to package, configure and easily deploy our code. Containerization is an approach that is widely adopted for the same. And what technology pioneered the use of containers? - Docker!
4.1 - Docker
The pioneer in containerization
Docker provides various services such as the Docker daemon (dockerd), Docker CLI, and Docker Hub Registry that help package applications in containers and host them. As we learned in containers, the several problems of software not being able to run on some machine and portability of software are solved by containers and Docker provides salient tools to make it possible.
Docker architecture
Let’s discuss the architecture of Docker Engine which comprises of Docker client (CLI), Docker Host that contains the Docker daemon which manages the different containers, and the software that needs to be packaged to a container i.e., an image made available on a registry.

Docker Hub
This is the default registry that Docker uses to fetch images to be run inside containers. But what is an image? A Docker image is a template file that contains the instructions to create a container. Each image has a base image typically a minimal Linux-based operating system such as Alpine and on top of this image, we can add layers of our own images. This can be done using a Dockerfile.
The following is an example Dockerfile:
FROM python:3.7
LABEL maintainer="Pankaj Khushalani"

COPY ./exercises/python-helloworld /app
WORKDIR /app
RUN pip install -r requirements.txt

CMD [ "python", "app.py" ]
Each line contains a keyword following by a flag or a command to be run. In the first line of the Dockerfile, the base image follows the FROM keyword. Here, python:3.7 is the name of the base image, which is hosted on Docker Hub and is downloaded when this Dockerfile is run. python:3.7 contains the Linux-based light-weight OS Alpine which comes with Python version 3.7 installed on it.
Docker daemon
This is the server that hosts and manages the several Docker containers that we would like to run. The communication between different containers is also handled by the daemon. It also plays an important role in creating a Docker container from images pulled from Docker Hub.
Docker CLI
You can interact with the Docker daemon using Docker CLI. This includes creating a Docker container from a Dockerfile or an image directly fetched from Docker Hub, interacting with a Docker container, managing them, etc. You can read the documentation for the list of available commands.
Learn
-
Install Docker and have a go at it! Docker Engine comes with Docker Desktop for Windows and macOS, while for Linux distributions, Docker Engine can directly be downloaded and used. You can find the installation guide here.
-
DevOps with Docker is an MOOC by the University of Helsinki and a great resource to learn the ins and outs of Docker.
-
A video tutorial on Docker from Tech World With Nana
5 - E
Event-Driven Architecture
Microservices — is an architectural style that structures an application as a collection of loosely coupled services, which implement business capabilities.
- Chris Richardson
Before understanding Event-Driven Architecture (EDA), let’s first understand what an event is,
An event is a state change or an update within the system that triggers the action of other systems. It can be anything from a transaction and sensor input to a mouse click and a photo upload, etc.
With that said,
Event-driven architecture is a design model that connects distributed software systems and allows for efficient communication. EDA makes it possible to exchange information in real time or near real time. It is common in designing apps that rely on microservices (you’ll get to know what this mean real soon but for now consider that when each service runs its own process and communicates through APIs with other services, then these services are considered as microservices.)
The concept of event-driven architecture is mainly realized through the publish/subscribe communication model (We covered this during GCP'21, hope y’all remember!).
Just to brief,
Publish/subscribe is a flexible messaging pattern that allows disparate system components to interact with one another asynchronously.
How does event-driven architecture work?
Event-driven architecture is made up of event producers and event consumers. An event producer detects or senses an event and represents the event as a message. It does not know the consumer of the event, or the outcome of an event.
After an event has been detected, it is transmitted from the event producer to the event consumers through event channels, where an event processing platform processes the event asynchronously. Event consumers need to be informed when an event has occurred. They might process the event or may only be impacted by it.
The event processing platform will execute the correct response to an event and send the activity downstream to the right consumers. This downstream activity is where the outcome of an event is seen.

Where can this approach be used in your next project?
To monitor and receive alerts for any anomalies or changes to storage buckets, database tables, virtual machines, or other resources.
To fan out a single event to multiple consumers. The event router will push the event to all the appropriate consumers, without you having to write customized code. Each service can then process the event in parallel, yet differently.
To provide interoperability between different technology stacks while maintaining the independence of each stack.
5.1 - Eventarc
A unified eventing experience in Google Cloud.
Eventarc allows you to build event-driven architectures without having to implement, customize, or maintain the underlying infrastructure. Eventarc offers a standardized solution to manage the flow of state changes, called events, between decoupled microservices. When triggered, Eventarc routes these events through Pub/Sub subscriptions to various destinations while managing delivery, security, authorization, observability, and error-handling for you.
You can manage Eventarc from the Google Cloud Console, from the command line using the gcloud CLI, or by using the Eventarc API.
Benefits Of Eventarc
Eventarc provides an easier path to receive events not only from Pub/Sub topics but from a number of Google Cloud sources with its Audit Log and Pub/Sub integration. Any service with Audit Log integration or any application that can send a message to a Pub/Sub topic can be event sources for Eventarc. You don’t have to worry about the underlying infrastructure with Eventarc. It is a managed service with no clusters to set up or maintain.
It also has some concrete benefits beyond the easy integration. It provides consistency and structure to how events are generated, routed, and consumed.
Learn
Check out the Eventarc documentation for more information.
A few code samples are available here.
6 - F
Function-as-a-Service(FaaS)
In the serverless world, Function-as-a-Service allows to write small pieces of code that do something Just like any other function, but serverless. That means: The function is sleeping in a fluffy cloudy container and only when it is needed, it wakes up and does something, and the good news: A sleeping function doesn’t cause cost.
- Carlos Roggan
What is Function-as-a-Service?
Function-as-a-Service (FaaS) is a serverless way to execute modular pieces of code on the edge. FaaS lets developers write and update a piece of code on the fly, which can then be executed in response to an event, such as a user clicking on an element in a web application. This makes it easy to scale code and is a cost-efficient way to implement microservices.
Hosting a software application on the internet typically requires provisioning and managing a virtual or physical server and managing an operating system and web server hosting processes. With FaaS, the physical hardware, virtual machine operating system, and web server software management are all handled automatically by your cloud service provider. This allows you to focus solely on individual functions in your application code.
How FaaS works?
FaaS gives developers an abstraction for running web applications in response to events, without managing servers. For example, uploading a file could trigger custom code that transcodes the file into a variety of formats.
FaaS infrastructure is usually metered on-demand by the service provider, primarily through an event-driven execution model, so it’s there when you need it but it doesn’t require any server processes to be running constantly in the background, like platform-as-a-service (PaaS) would.
Functions can be accessed through one of several triggers that you define when you create the function. For use in an app, functions can occur on events that happen in the database. For example, a function can be triggered when a new item is written to a database, changed, or deleted from the database.
An “on-event” function might send an email to a user when their account is created. A function could also be written to send a notification to a user, or set of users, in a chatroom when a new message has been written to the room (equivalent to a new write on the database).
What are the advantages of using FaaS?
- Improved developer velocity
With FaaS, developers can spend more time writing application logic and less time worrying about servers and deploys. This typically means a much faster development turnaround.
- Built-in scalability
Since FaaS code is inherently scalable, developers don’t have to worry about creating contingencies for high traffic or heavy use. The serverless provider will handle all of the scaling concerns.
- Cost efficiency
Unlike traditional cloud providers, serverless FaaS providers do not charge their clients for idle computation time. Because of this, clients only pay for as much computation time as they use, and do not need to waste money
over-provisioning cloud resources.
- Functions can be written in almost any programming language
What are the drawbacks of FaaS?
- Less system control
Having a third party manage part of the infrastructure makes it tough to understand the whole system
and adds debugging challenges.
- More complexity required for testing
It can be very difficult to incorporate FaaS code into a local testing environment, making thorough testing of an application a more intensive task.
Use Cases
Because it enables transactions to be isolated and scaled easily, FaaS is good for high-volume and embarrassingly parallel workloads. It can also be used to create backend systems or for activities such as data processing, format conversion, encoding, or data aggregation.
FaaS is also a good tool for Web apps, backends, data/stream processing, or to create online chatbots or back ends for IoT devices.
FaaS can help you manage and use third-party services. If you’re considering Android app development, for example, you can adopt a FaaS approach to keep your costs in check. Because you’re only charged when your app connects to the cloud for a specific function like batch processing, costs can be considerably lower than they would using a traditional approach.
FaaS vs Serverless
Serverless and Functions-as-a-Service (FaaS) are often conflated with one another but the truth is that FaaS is actually a subset of serverless. Serverless is focused on any service category, be it compute, storage, database, messaging, api gateways, etc. where configuration, management, and billing of servers are invisible to the end user. FaaS, on the other hand, while perhaps the most central technology in serverless architectures, is focused on the event-driven computing paradigm wherein application code, or containers, only run in response to events or requests.
The combination of FaaS and common back-end services (such as databases, messaging, and authentication) connected primarily through an event-driven architecture is what provides the best benefits for serverless developers.
6.1 - Firebase Cloud Functions
Create functions that respond to events generated by Firebase and Google Cloud features.
Cloud Functions for Firebase is a serverless framework that lets you automatically run backend code in response to events triggered by Firebase features and HTTPS requests. Your JavaScript or TypeScript code is stored in Google’s cloud and runs in a managed environment. There’s no need to manage and scale your own servers.
What is Firebase Cloud Functions?
Firebase Cloud Functions in particular are like Lego blocks that you can connect to any Firebase service. For example, a function can be triggered when an image is uploaded to Firebase Storage to create a thumbnail, or maybe clean some user data when a node is deleted in the Realtime Database. Pretty much anything of interest that happens in Firebase can trigger a function.
If that isn’t enough, you can also use HTTP to trigger functions with GET, POST, etc.
How does it work?
Cloud Functions for Firebase lets you automatically run backend code in response to events triggered by Firebase features and HTTPS requests. Your code is stored in Google’s cloud and runs in a managed environment. There’s no need to manage and scale your own servers, for example, if we have a chatting mobile app that uses firebase to store the messages and we want to filter the messages before they are written to the database so as to make sure there are no bad words included in any message, before the cloud functions were made that was really hard to achieve and most probably we would need someone to write a backend code to do this check, but today, all we need to do is just write a simple cloud function that triggers whenever any message is added to our database and filter it out.
It is very powerful especially for mobile developers that have no knowledge on how to write web apps or backend, you can also integrate with third-party APIs like Slack and Github.
Use Cases
Cloud Functions allows developers access to Google Cloud events and Firebase, along with scalable computing power for running the code in response to those events. It is expected that Firebase applications will use Cloud Functions in unique ways to meet their unique and specific needs, use cases may fall into the following areas:
- Notifying users when something interesting happens.
- Performing Realtime Database maintenance and sanitization.
- Executing intensive tasks in the cloud rather than executing in our application.
- Integrate with APIs and third-party services.
Learn
Learn more about Firebase Cloud Functions from the official documentation.
Learn Cloud Functions for Firebase with this codelab
7 - G
A geographic information system (GIS) is a system that creates and manages geographic data (data for which location is relevant), analyzes this geographic data, and maps it. Hence the four main ideas of such as system are:
You can find the use of GIS in a food delivery tracker in a mobile app where the location of your meal is continually fethced from an API providing geographic data. This data is then analyzed to give you an estimated time of delivery and all of this is being mapped and visualized in the mobile app in real-time.
How does cloud computing come into the picture?
-
Geographic data such as location or coordinates along with spatial data such as the shapes that make up a geography such as a point, line, polygon, etc. These data together form geospatial data which is complex in nature and takes up a lot more space than the traditional relational data. Hence cloud is leveraged to store copious amounts of such data and analysis is carried out using Big Data services such as BigQuery.
-
With the COVID-19 pandemic, it became essential to create visualizations of real-time changes in COVID cases. To manage such real-time changes, data from several APIs needs to be consumed to produce a new change and hence, services such as Cloud Pub/Sub can be seen here.
7.1 - Google Maps Platform
Leveraging the power of Google Maps
One of the most prominent applications of GIS is Google Maps. Google Cloud Platform provides various services of Google Maps via the Google Maps Platform. It provides SDKs and APIs to effectively use Google Maps in our applications.
The platform provides APIs in the following categories:
-
Maps
- Dynamic Maps for JavaScript, Android, iOS
- Dynamic Street View for JavaScript, Android, iOS
- Static Maps API
-
Places
- Autocomplete API
- Geocoding API
- Geolocation API
- Place Details API for Android and iOS
-
Routes
Learn
8 - H
Health Checks
Disclaimer: This is going to be a comparatively simple concept, but a highly important concept, so important that from the smallest of all application servers of small scale companies to the application servers of large MNCs, they all use this concept.
What does buying a car and managing a cloud environment have in common? If you don’t pay attention they both can end up costing you much more than expected. That’s why keeping a close eye on your cloud environment is very important, and this is what health checks do.
Health Checks check the working status of your servers by sending them periodic messages, the servers in turn reply to these messages. If the server fails to respond to these messages, it would be considered that the server isn’t functioning properly and appropriate actions would be taken.
The actions include:
- Sending Emails to the administrator
- Sending SMS to the administrator
- Running some scripts
- And many others.
Benefits of Health Checks
-
Increased cloud efficiency
In a fast-paced environment, it’s expected that operational decisions be made quickly. The Health Check provides a high-level summary of your cloud environment to help you make more informed decisions, faster.
-
Improved cloud governance
Your cloud environment is only as good as the hygiene that you establish for it— and your organization’s diligence to keep those practices in place long term. Especially if you are just starting in your cloud environment, you might not be aware of common pitfalls. For example, assets that are unallocated or untagged, such as untagged instances, are very common. If not addressed quickly, they can lead to a lot of cloud resource waste. The Health Check gives you a quick snapshot to help identify these assets and allow you to build and customize reports to focus on a particular business unit, owner, environment or function.
-
De-risk your cloud with confidence
Security is a critical component for any cloud environment. In this day and age, keeping data safe and secure is equally, if not more important, than reducing cost increasing agility. Health Checks highlights any potential security vulnerabilities. This alerts your team to take any necessary actions needed before something can potentially go wrong. As they say, prevention is better than cure. This report gives you recommendations about security related events in your cloud environment.
8.1 - Cloud Monitoring
Keep an 👁️ on your cloud environment
Cloud monitoring is the process of reviewing and managing the operational workflow and processes within a cloud infrastructure or asset. These techniques confirm the performance of websites, servers, applications, and other cloud infrastructure.
Cloud Monitoring collects measurements of your service and of the Google Cloud resources that you use.
How it helps?
It:
-
Monitor CPU and memory details.
-
Keep tabs on disk utilization.
-
Achieve maximum network efficiency.
-
Effectively track firewall metrics.
-
Track quota metrics with ease.
-
Helps you to plan ahead with insightful reports.
Learn
9 - I
Infrastructure-as-a-Service(IaaS)
What is Infrastructure-as-a-Service?
Infrastructure as a Service is a type of cloud computing service providing computing resources over the internet. IaaS is one of three main categories of cloud computing services. The other two are Software as a Service (SaaS) and Platform as a Service (PaaS).
Infrastructure as a Service (IaaS) means that the infrastructure is hosted on the public and/or private cloud, instead of on an on-premises server. It’s delivered to customers on-demand and is fully managed by the IaaS provider. This includes all the infrastructure components an on-premises data center would traditionally entail, such as servers, networking hardware, and storage.
Often, the IaaS provider also offers a range of services to complement those components, such as detailed billing, security, monitoring, and clustering. Storage resiliency, like backup and recovery processes, is also included. IaaS allows users to develop, grow, and scale without buying and maintaining physical hardware.
Benefits of Infrastructure-as-a-Service
You can think of infrastructure as a service a little bit like taxis or hotels. It would be extremely inefficient for people to try to own transportation or housing everywhere they went. The vast majority of the time, their transportation or housing would go unused, and it would provide no value.
It is much more efficient for companies to own huge quantities of transportation or housing. That way, they can provide it to people only when those people need it. The same basic principle applies to computing power and storage space.
Sometimes you might need huge quantities of computing power or storage space, but most of the time, you do not. It would be extremely inefficient for you to have to own all of the servers necessary to manage your occasional increased need for computing power.
It is much more efficient to rent from an infrastructure as a service company so that you only have to pay for your computing or storage when you actually need it.
-
It’s economical
Because IaaS resources are used on demand and enterprises only have to pay for the compute, storage, and networking resources that are actually used, IaaS costs are fairly predictable and can be easily contained and budgeted for.
-
It’s efficient
IaaS resources are regularly available to businesses when they need them. As a result, enterprises reduce delays when expanding infrastructure and, alternatively, don’t waste resources by overbuilding capacity.
-
It boosts productivity
Because the cloud provider is responsible for setting up and maintaining the underlying physical infrastructure, enterprise IT departments save time and money and can redirect resources to more strategic activities.
-
It’s reliable
IaaS has no single point of failure. Even if any one component of the hardware resources fails, the service will usually still remain available.
-
It’s scalable
One of the biggest advantages of IaaS in cloud computing is the capability to scale the resources up and down rapidly according to the needs of the enterprise.
-
It drives faster time to market
Because IaaS offers virtually infinite flexibility and scalability, enterprises can get their work done more efficiently, ensuring faster development life cycles.
IaaS Architecture
IaaS is broken into three main components: compute, network, and storage. With these offerings, users have the building blocks they need to create their customized systems, as complicated or powerful as they need, and the ability to scale up and down based on current needs.
Compute
Foundational IaaS computing resources begin with servers. Servers are powerful computers that tend to have hundreds of Central Processing Units (CPUs), hundreds or thousands of gigabytes (GBs) of Random-access memory (RAM), and thousands of GBs of storage. Servers are expensive to buy and costly and difficult to maintain. IaaS providers maintain data centers that house the physical, bare-metal servers. These physical servers can be partitioned using a hypervisor into smaller “virtual machines”. These virtual machines can run their OS and applications independently while sourcing power from the bare-metal server.
There are different ways to set up a virtual machine (VM), and the architecture you choose will depend on your needs and the level of abstraction you prefer.
Compute offerings often include optional add-ons like load balancing, which automatically distributes network traffic to prevent system overload.
When users purchase a virtual machine through an IaaS provider, they choose the operating system, often referred to as an image, and applications run on that machine. Developers can easily scale vertically by adding more CPU if their VMs don’t have enough processing power or scaling horizontally to increase instances and handle more load. Virtual machines can often be quick and easy to set up.
Storage
Storage options are threefold: file storage, object storage and block storage.
File storage is similar to what we have on our computers at home and stores data as a single entity into a file. The files can exist within each other as other data, so it’s hierarchical. For example, a path for file storage could be “/home/photos/selfie.jpg”. Object storage instead takes saved data as a single entity and appends metadata and an identifier. Object storage deals with whole objects stored over the network. These objects could be things like an image file, logs, or HTML files. Object storage is the most popular option because of its simplicity and cost savings. Block storage is likely underneath the file or object storage. Block storage services are relatively familiar. They provide access to a traditional block storage device over the network and attach it to your virtual machine. It takes data and saves it as blocks of actual bytes or bits. It has advantages over the other two by being faster to transfer data but not user friendly unless abstracted by a file system like in your computer that uses it.
Network
The network function talks to the storage function, other VMs, containers, other servers, the internet, the intranet, and other components. It’s how information is transferred through the architecture regardless of endpoints. Users will need different networking bandwidths depending on the amount of data transmitted between computing resources.
Use Cases
IaaS has multiple applications that span industries, company sizes, and business needs. Startups and small companies may prefer IaaS to avoid the high costs of purchasing and maintaining hardware and software, and companies experiencing rapid growth like the scalability of IaaS. Larger companies may want the ability to buy only the space they will use. They also often use IaaS for redundancy in their setup and to take advantage of the high availability of public cloud providers.
Some common use cases for IaaS are:
- Website hosting: IaaS provides flexible hosting options for developers looking to get their websites up and running quickly and reliably. Using cloud services also allows builders to easily maintain and scale their sites as they grow.
- Startups: IaaS allows startups and other small businesses to avoid the high cost of purchasing and maintaining physical hardware to sustain a cool new idea. A startup in a rapid growth period can enjoy the scalability of IaaS.
- Testing and development: IaaS allows teams to quickly set up and tear down testing and development environments, allowing new applications to make it to market more quickly.
- Storage and backup: Using IaaS for data storage and backup allows an organization to maintain resiliency without the significant overhead of additional on-site hardware. Using an IaaS provider can also help the team manage legal and compliance requirements that may otherwise be difficult to understand or implement.
- Building and maintaining web applications: IaaS provides the infrastructure needed to support web applications, such as storage, servers, and networking resources. Web applications can be quickly deployed on IaaS and then can continue to scale up and down with demand, providing reliability for the platform and cost savings for the team.
- High-performance computing needs: Organizations can solve complex problems and conduct detailed research and data analysis using supercomputers and computer grids or clusters. IaaS can provide the infrastructure to maintain those needs. Game developers and streaming services also utilize IaaS for flexibility, maintaining low latency, and saving bandwidth.
IaaS Pricing
Common IaaS pricing generally follows one of these models:
Subscriptions:
Some providers offer discounts for customers who commit to longer contract terms. Pricing for subscription-based services can be more favorable but also locks you into a vendor for a set amount of time, which can be a disadvantage if your needs change or your experience with that vendor is not up to your expectations.
Pay-as-you-go:
The most common way for traditional IaaS providers to bill is by the hour/second, and users are only charged for what they use. This is beneficial in that generally, a pay-as-you-go model enables you to switch cloud providers easily if needed, and your bill may go up and down depending on usage. However, it can also lead to unexpected increases in cost if usage goes up and pricing models are not always clear.
9.1 - IaaS offering by GCP - Google Compute Engine
Secure and customizable compute service that lets you create and run virtual machines on Google’s infrastructure.
What is Google Compute Engine?
Google Compute Engine (GCE) is an Infrastructure as a Service (IaaS) offering that allows clients to run workloads on Google’s physical hardware.
Google Compute Engine provides a scalable number of virtual machines (VMs) to serve as large compute clusters for that purpose. GCE can be managed through a RESTful API, command line interface (CLI) or Web console. Compute Engine is a pay-per-usage service with a 10-minute minimum. There are no up-front fees or time-period commitments. GCE competes with Amazon’s Elastic Compute Cloud (EC2) and Microsoft Azure.
GCE’s application program interface (API) provides administrators with virtual machine, DNS server and load balancing capabilities. VMs are available in a number of CPU and RAM configurations and Linux distributions, including Debian and CentOS. Customers may use their own system images for custom virtual machines. Data at rest is encrypted using the AEC-128-CBC algorithm.
GCE allows administrators to select the region and zone where certain data resources will be stored and used. Currently, GCE has three regions: United States, Europe and Asia. Each region has two availability zones and each zone supports either Ivy Bridge or Sandy Bridge processors. GCE also offers a suite of tools for administrators to create advanced networks on the regional level.
Applications Of Compute Engine
Below are some of the use-cases or applications of the Google compute engine:
- Virtual Machine (VM) migration to Compute Engine: It provides tools to fast-track the migration process from on-premise or other clouds to GCP. If a user is starting with the public cloud, then they can leverage these tools to seamlessly transfer existing applications from their data center, AWS, or Azure to GCP. Users can have their applications running on Compute Engine within minutes while the data migrate transparently in the background.
- Genomics Data Processing: Processing genomic data is computationally-intensive because the information is enormous with vast sets of sequencing. With the Compute Engine’s potentials, users can process such large data sets. The platform is not only flexible but also scalable when it comes to processing genomic sequences.
- BYOL or Bring Your Own License images: A Compute Engine can help you run Windows apps in GCP by bringing their licenses to the platform as either license-included images or sole-tenant nodes. When users migrate to GCP, they can flexibly optimize their license and promote the bottom line.
Advantages Of Compute Engine
-
Storage Efficiency: The persistent disks support up to 257 TB of storage which is more than 10 times higher than what Amazon Elastic Block Storage (EBS) can accommodate. The organizations that require more scalable storage options can go for Compute Engine
-
Cost: Within the GCP ecosystem, users pay only for the computing time that they have consumed. The per-second billing plan is used by the Google compute engine.
-
Stability: It offers more stable services because of its ability to provide live migration of VMs between the hosts.
-
Backups: Google Cloud Platform has a robust, inbuilt, and redundant backup system. The Compute Engine uses this system for flagship products like Search Engine and Gmail.
-
Scalability: It makes reservations to help ensure that applications have the capacity they need as they scale.
-
Easy Integration: It allows to easily integrate with other Google Cloud services like AI/ML and data analytics.
-
Security: Google Compute Engine is a more secure and safe place for cloud applications.
Learn
Learn more about Google Compute Engine from the official documentation
Explore Google Compute Engine with this codelab
10 - J
Job Scheduling
We often have repetitive tasks to perform such as checking internet connection every few hours, maybe checking stock prices every few hours, or checking if that one product has gone on sale on an e-commerce site. Instead of having to do this manually, you can schedule these tasks to run at regular intervals.
For example, consider this check_internet.sh Bash script to check if you are connected to the internet or not by pinging Google’s webpage:
echo -e "GET http://google.com HTTP/1.0\n\n" | nc google.com 80 > /dev/null 2>&1

if [ $? -eq 0 ]; then
    echo "Online"
else
    echo "Offline"
fi
Now, to run this script say, every 2 hours to check for internet connection, we use the crontab utility in Linux.
# enters the configuration file that contains cron jobs to be scheduled
crontab -e
# run this script every 2 hours
0 */2 * * *  check_internet.sh
Let’s not get ahead of ourselves and first see what is a cron job and what does this terrible syntax 0 */2 * * * mean.
What is a cron job?
Derived from the Greek God of Time, Chronos, a cron job is a task that is scheduled by a job scheduler such as crontab on Linux-based operating systems and by cron on a Unix-like operating system.
To learn more about the uncommon asterisk syntax, refer crontab.guru
Though checking the internet connection is a trivial example, we have seen in health checks how important it is to check if a server or an application is healthy (alive) or not.
Why do you need cloud for scheduling cron jobs?
From health checks to thousands of repetitive tasks such as fetching data from several APIs, to scheduling a job based on an event trigger, manually managing so many jobs becomes impossible. Hence, to manage jobs at scale, cloud is at our behest.
Job scheduling tools such as Google Cloud’s Cloud Scheduler enable automation of execution of tasks based on date-time scheduling or other methods of execution such as event-based triggers. It eliminates the need for manual kick-offs, reducing delays and avoiding repetitive tasks.
10.1 - Cloud Scheduler
Schedule virtually everything
Cloud Scheduler is a fully managed enterprise-grade cron job scheduler. It allows you to schedule virtually any job, including batch, big data jobs such as ETL, and cloud infrastructure operations. You can automate everything, including retries in case of failure to reduce manual toil and intervention.

Leveraging Cloud Scheduler
Cloud Scheduler can be used in the following ways:
-
Reduce minimal manual effort by scheduling repetitive Big Data tasks such as fetching and preprocessing of data for a data pipeline
-
Downscale or upscaling cloud infrastructure when needed in a reliable manner
-
Automate health checks, trigger a Cloud Pub/Sub pipeline, and a lot more with integration with our GCP services
Learn
11 - K
Kubernetes
Before starting with the technical jargon related to K8s, I would like to redirect y’all to this post which explains the usecase of kubernetes.
Hope y’all now have a basic understanding of what it does. So, now let’s move to some technical terminologies.
What is Kubernetes(or simply K8s)?
Kubernetes is an open-source container-orchestration system for automating application deployment, scaling, and management.
There are two main words here: container and orchestration. We need to understand what each one is to understand Kubernetes.
What are Containers?
Containers are a technology for packaging the (compiled) code for an application along with the dependencies it needs at run time. Each container that you run is repeatable; the standardisation from having dependencies included means that you get the same behaviour wherever you run it.
Pretty Complicated right? Let me explain it.
If we need to spin up a stack of applications in a server, such as a web application, database, messaging layer, etc., this will result in the following scenario.

There is a hardware infrastructure on which an operating system (OS) runs, and libraries and application dependencies are installed over the OS. Different applications then share the same libraries and dependencies to run.
If you look into the design described, there are bound to be multiple problems. If you’ve rightly guessed, a web server might need a different version of a library as compared to the database server, for example, and one version of dependency can be compatible with one application but incompatible with another. If we need to upgrade one of the dependencies, we need to ensure that we do not impact another application that might not support it. This scenario is known as the Matrix of Hell and is a nightmare for developers and admins alike.
Solutions 1:
Virtual Machines (VMs):
A virtual machine is an emulation of a computer system. Virtual machines are based on computer architectures and provide the functionality of a physical computer using software called a hypervisor. Some of the popular hypervisors in the market are VMWare and Oracle Virtual Box. A typical VM-based stack looks like this:

We have resolved the dependency problem, and now we are out of the Matrix of Hell. However, this introduces another issue. Instead of running a single OS within a machine, we now have multiple guest OSs running within a physical device.
Solutions 2:
Containers balance the problem out by treating servers as servers. We no longer have a separate VM for the webserver, database, and messaging. Instead, we have different containers for them.

We have now got rid of the guest OS dependency, and containers now run as separate processes within the same OS. Containers make use of container runtimes. One of the famous container runtimes is Docker. I won’t be talking about Docker here as it is a big concept in itself, however attaching a post which gives a quick overview.
The idea of having multiple containers running within a server sounds tempting, but they come with their own set of problems. How you scale containers? How do you ensure that containers run and heal when they are unhealthy? What would happen if you suddenly see a spike and want to scale up your containers automatically? and many more…
Now this is where K8s comes to rescue.
Container Orchestration Using Kubernetes
The idea of using Kubernetes is simple. You have a cluster of servers that are managed by Kubernetes, and Kubernetes is responsible for orchestrating your containers within the servers. You treat servers as servers, and you run applications within self-contained units called containers.
Since containers can run the same in any server, it does not matter on what server your container is running, as long as the client can reach it. If you need to scale your cluster, you can add or remove nodes to the cluster without worrying about the application architecture, zoning, roles, etc. You handle all of these at the Kubernetes level.
Kubernetes uses a simple concept to manage containers. There are master nodes (control plane) which control and orchestrate the container workloads, and the worker nodes where the containers run. Kubernetes run containers in pods, which form the basic building block in Kubernetes.
Following is a high-level architecture of a Kubernetes cluster:

Feel free to read more about the K8s architecture here
Know more about this concept through these documentries - Part1 and Part2
11.1 - Google Kubernetes Engine
Manage your containers with GKE

Google Kubernetes Engine (GKE) provides a managed environment for deploying, managing, and scaling your containerized applications using Google infrastructure. The GKE environment consists of multiple machines (specifically, Compute Engine instances) grouped together to form a cluster.
Learn
12 - L
Load Balancing
What is Load Balancing?
Imagine you’re in charge of a complex website, and it’s an online hit! It continues to face high amounts of traffic and you’re not sure your website backend can handle the amount of traffic from all over the world. You know you need to use load balancers, but the options are confusing. It can be hard to know exactly how to settle on a load balancing architecture that meets your needs, and figure out the prerequisites you need, for the best performance, without making too much of a dent in your wallet.
To start, you need to know what load balancing is and why it’s so important to the long-lasting success of your application.
Load balancing is the process of distributing traffic across your network of servers to ensure that the system does not get overwhelmed and all requests are handled easily and efficiently.
Modern high‑traffic websites serve hundreds of thousands, if not millions, of concurrent requests from users or clients and return the correct text, images, video, or application data, all in a fast and reliable manner. You’ve probably all experienced visiting your favorite website, only to get long wait times, connection timeout errors, or images and videos buffering. And a lot of the times, this is because the website backend is unable to cost‑effectively scale to meet these high volumes.
The logical answer here is to add more backend servers to help serve traffic. But the next question becomes, how do you distribute traffic to those backend servers based on capacity and health?
This is where load balancing makes a splash.
In the seven-layer Open System Interconnection (OSI) model, network firewalls are at levels one to three (L1-Physical Wiring, L2-Data Link and L3-Network). Meanwhile, load balancing happens between layers four to seven (L4-Transport, L5-Session, L6-Presentation and L7-Application).

Load Balancers
As an organization meets demand for its applications, the load balancer decides which servers can handle that traffic. This maintains a good user experience.
Load balancers manage the flow of information between the server and an endpoint device (PC, laptop, tablet or smartphone). The server could be on-premises, in a data center or the public cloud. The server can also be physical or virtualized. The load balancer helps servers move data efficiently, optimizes the use of application delivery resources and prevents server overloads. Load balancers conduct continuous health checks on servers to ensure they can handle requests. If necessary, the load balancer removes unhealthy servers from the pool until they are restored. Some load balancers even trigger the creation of new virtualized application servers to cope with increased demand.
Traditionally, load balancers consist of a hardware appliance. Yet they are increasingly becoming software-defined. This is why load balancers are an essential part of an organization’s digital strategy.
Load balancers have different capabilities, which include:
- L4 — directs traffic based on data from network and transport layer protocols, such as IP address and TCP port.
- L7 — adds content switching to load balancing. This allows routing decisions based on attributes like HTTP header, uniform resource identifier, SSL session ID and HTML form data.
- GSLB — Global Server Load Balancing extends L4 and L7 capabilities to servers in different geographic locations.
Why Load Balancing?
There is a limitation to the number of requests a single computer can handle at a given time. When faced with a sudden surge in requests, your application will load slowly, the network will time out, and your server will creak. You have two options: scale up or scale out.
When you scale up (vertical scale), you increase the capacity of a single machine by adding more storage (Disk) or processing power (RAM, CPU) to an existing single machine as needed on demand. But scaling up has a limit — you’ll get to a point where you cannot add more RAM or CPUs.
A better strategy is to scale out (horizontal scale), which involves the distribution of loads across as many servers as necessary to handle the workload. In this case, you can scale infinitely by adding more physical machines to an existing pool of resources.
Load Balancing and Security
Load Balancing plays an important security role as computing moves evermore to the cloud. The off-loading function of a load balancer defends an organization against distributed denial-of-service (DDoS) attacks. It does this by shifting attack traffic from the corporate server to a public cloud provider. DDoS attacks represent a large portion of cybercrime as their number and size continues to rise. Hardware defense, such as a perimeter firewall, can be costly and require significant maintenance. Software load balancers with cloud offload provide efficient and cost-effective protection.
Load Balancing Algorithms
There are a variety of load balancing methods, which use different algorithms best suited for a particular situation.
-
Least Connection Method — directs traffic to the server with the fewest active connections. Most useful when there are a large number of persistent connections in the traffic unevenly distributed between the servers.
-
Least Response Time Method — directs traffic to the server with the fewest active connections and the lowest average response time.
-
Round Robin Method — rotates servers by directing traffic to the first available server and then moves that server to the bottom of the queue. Most useful when servers are of equal specification and there are not many persistent connections.
-
IP Hash — the IP address of the client determines which server receives the request.
The Benefits
Load balancing can do more than just act as a network traffic cop. Software load balancers provide benefits like predictive analytics that determine traffic bottlenecks before they happen. As a result, the software load balancer gives an organization actionable insights. These are key to automation and can help drive business decisions.
The benefits of load balancing include the following:
-
Prevents Network Server Overload
When using load balancers in the cloud, you can distribute your workload among several servers, network units, data centers, and cloud providers. This lets you effectively prevent network server overload during traffic surges.
-
High Availability
The concept of high availability means that your entire system won’t be shut down whenever a system component goes down or fails. You can use load balancers to simply redirect requests to healthy nodes in the event that one fails.
-
Better Resource Utilization
Load balancing is centered around the principle of efficiently distributing workloads across data centers and through multiple resources, such as disks, servers, clusters, or computers. It maximizes throughput, optimizes the use of available resources, avoids overload of any single resource, and minimizes response time.
-
Prevent a Single Source of Failure
Load balancers are able to detect unhealthy nodes in your cluster through various algorithmic and health-checking techniques. In the event of failure, loads can be transferred to a different node without affecting your users, affording you the time to address the problem rather than treating it as an emergency.
12.1 - Cloud Load Balancing
High performance, scalable load balancing on Google Cloud Platform.
Load balancers are managed services on GCP that distribute traffic across multiple instances of your application. GCP bears the burden of managing operational overhead and reduces the risk of having a non-functional, slow, or overburdened application.
With Google Cloud Load Balancing, you can serve content as close as possible to your users, on a system that can respond to over 1 million queries per second!
Different load balancing options
To decide which load balancer best suits your implementation, you need to think about whether you need
- Global or regional load balancing. Global load balancing means backend endpoints live in multiple regions. Regional load balancing means backend endpoints live in a single region.
- External or internal load balancing
- What type of traffic you are serving? HTTP, HTTPS, SSL, TCP, UDP etc.
External load balancer
External load balancing includes four options:
- HTTP(S) Load Balancing for HTTP or HTTPS traffic,
- TCP Proxy for TCP traffic for ports other than 80 and 8080, without SSL offload
- SSL Proxy for SSL offload on ports other than 80 or 8080.
- Network Load Balancing for TCP/UDP traffic.
-
HTTP(S) load balancers
Global HTTP(S) load balancing if for layer-7 traffic
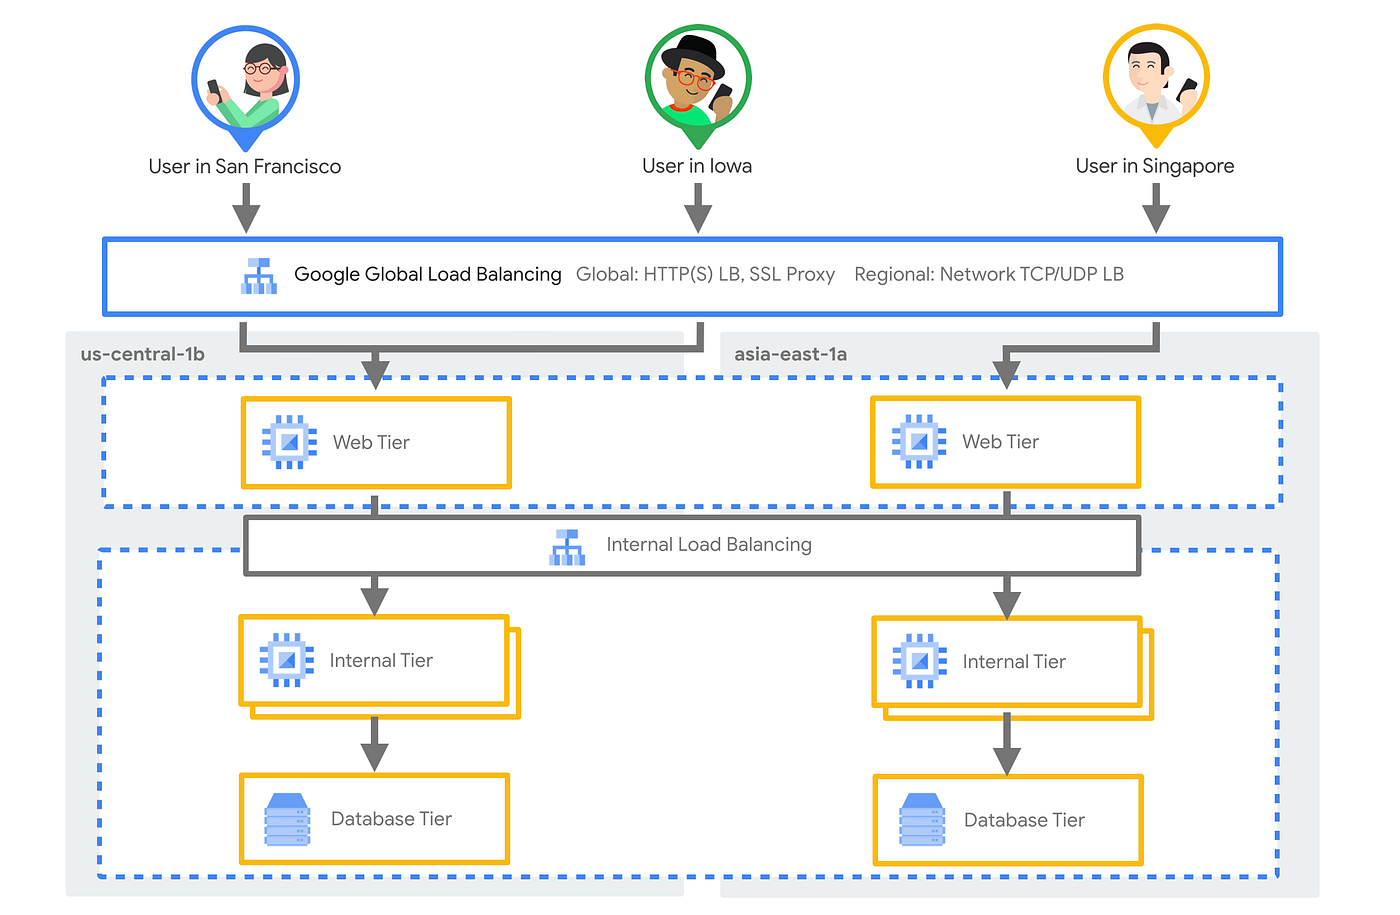
Google pushed load balancing out to the edge network on front-end servers, as opposed to using the traditional DNS-based approach. Thus, global load-balancing capacity can be behind a single Anycast virtual IPv4 or IPv6 address. This means you can deploy capacity in multiple regions without having to modify the DNS entries or add new load balancer IP address for new regions. So, it is clear that with global HTTP(S) load balancing, you get cross-region failover and overflow!
With global HTTP(S) load balancing, you get cross-region failover and overflow!
The distribution algorithm automatically directs traffic to the next closest instance with available capacity in the event of failure of or lack of capacity for instances in the region closest to end user.
-
Proxy based load balancers (TCP and SSL)
Google Cloud also offers proxy-based load balancers for TCP and SSL traffic, and they use the same globally distributed infrastructure.
Use TCP proxy load balancer when you are dealing with TCP traffic and do not need SSL offload.
Generally speaking, your decision to use them would depend on whether you require SSL offload or not. You can find out more in the links below.
Use SSL proxy load balancer when you are dealing with TCP traffic and need SSL offload.
-
Network load balancer
While the global HTTP(S) load balancer is for Layer-7 traffic and is built using the Google Front End Engines at the edge of Google’s network, the regional Network Load Balancer is for Layer-4 traffic and is built using Maglev.
Network load balancer is for the Layer-4 traffic.
Internal Load Balancer
With internal load balancing, you can run your applications behind an internal IP address and disperse HTTP/HTTPs traffic to your backend application hosted either on Google Kubernetes Engine (GKE) or Google Compute Engine (GCE).
The internal load balancer is a managed service that can only be accessed on an internal IP address and in the chosen region of your Virtual Private Cloud network. You can use it to route and balance load traffic to your virtual machines.
Similar to the HTTP(S) Load Balancer and Network Load Balancer, Internal L7 load balancer is neither a hardware appliance nor an instance-based solution, and can support as many connections per second as you need since there’s no load balancer in the path between your client and backend instances.
Internal layer 7 load balancer can support as many connections per second as your need!
The architecture for your website Beyond Treat (your one stop shop for vegan dog treats) would look something like this with an internal load balancer for the internal traffic, external global HTTPS load balancer for the incoming traffic.
Learn
Learn more about Cloud Load Balancing from the official documentation
Explore Cloud Load Balancing with the following codelabs:
- Host and scale a web app in Google Cloud with Compute Engine
- Setup Network and HTTP Load Balancers
13 - M
Microservices
…the microservice architectural style is an approach to developing a single application as a suite of small services, each running in its own process and communicating with lightweight mechanisms, often an HTTP resource API.
- Martin Fowler, Renowned author, Chief Scientist at ThoughtWorks
The above quote on microservices architecture is often deemed to be the textbook definition. Before we dive into what is a microservice, let’s look at the traditional practice of designing and developing software i.e., as a monolith.
Monolithic Architecture
In a monolithic architecture, application tiers can be described as:
- part of the same unit
- managed in a single repository
- sharing existing resources (e.g. CPU and memory)
- developed in one programming language
- released using a single binary

As student developers, we tend to follow this approach with a web framework such as Django or Spring where the UI and business logic are part of one repository. Thus, when we deploy such an application, we need to package the entire application as a single unit. Hence, if multiple people were to contribute on the application, their changes won’t be reflected unless the entire application is deployed again.
Microservices Architecture
In a microservice architecture, application tiers are managed independently, as different units. Each unit has the following characteristics:
- managed in a separate repository
- own allocated resources (e.g. CPU and memory)
- well-defined API for connection to other units
- implemented using the programming language of choice
- released using its own binary

To gain agility in the development cycle, several concerns (independent features) of a monolith can be split into microservices that can be developed and deployed individually. With such an architecture, the application becomes fault tolerant as there is no single point of failure - even if one microservice goes down or crashes, other microservices will still work at their concerns are independent.
Trade-offs
- Development Complexity: represents the effort required to deploy and manage an application.
- Scalability: captures how an application is able to scales up and down, based on the incoming traffic.
- Time to Deploy: encapsulates the build of a delivery pipeline that is used to ship features.
- Flexibility: implies the ability to adapt to new technologies and introduce new functionalities.
- Operational Cost: represents the cost of necessary resources to release a product.
- Reliability: captures practices for an application to recover from failure and tools to monitor an application.
| Trade-off |
Monolith |
Microservices |
| Development Complexity |
one programming language, one repository, enables sequential development |
multiple programming languages, multiple repositories, enables concurrent development |
| Scalability |
replication of the entire stack; hence it’s heavy on resource consumption |
replication of a single unit, providing on-demand consumption of resources |
| Time to Deploy |
one delivery pipeline that deploys the entire stack; more risk with each deployment leading to a lower velocity rate |
multiple delivery pipelines that deploy separate units; less risk with each deployment leading to a higher feature development rate |
| Flexibility |
low rate, since the entire application stack might need restructuring to incorporate new functionalities |
high rate, since changing an independent unit is straightforward |
| Operational Cost |
low initial cost, since one code base and one pipeline should be managed. However, the cost increases exponentially when the application needs to operate at scale |
high initial cost, since multiple repositories and pipelines require management. However, at scale, the cost remains proportional to the consumed resources at that point in time. |
| Reliability |
in a failure scenario, the entire stack needs to be recovered. Also, the visibility into each functionality is low, since all the logs and metrics are aggregated together. |
in a failure scenario, only the failed unit needs to be recovered. Also, there is high visibility into the logs and metrics for each unit. |
13.1 - Cloud Run
Run your microservices effortlessly
Cloud Run is a fully-managed compute environment for deploying and scaling serverless HTTP containers without worrying about provisioning machines, configuring clusters, or autoscaling.

Benefits of Cloud Run
-
No vendor lock-in - Because Cloud Run takes standard OCI containers and implements the standard Knative Serving API, you can easily port over your applications to on-premises or any other cloud environment.
-
Fast autoscaling - Microservices deployed in Cloud Run scale automatically based on the number of incoming requests, without you having to configure or manage a full-fledged Kubernetes cluster. Cloud Run scales to zero— that is, uses no resources—if there are no requests.
-
Split traffic - Cloud Run enables you to split traffic between multiple revisions, so you can perform gradual rollout such as canary deployments or blue/green deployments.
-
Custom domains - You can set up custom domain mapping in Cloud Run and it will provision a TLS certificate for your domain.
-
Automatic redundancy - Cloud Run offers automatic redundancy so you don’t have to worry about creating multiple instances for high availability
The following is an example of a microservices architecture using Cloud Run and several GCP services:
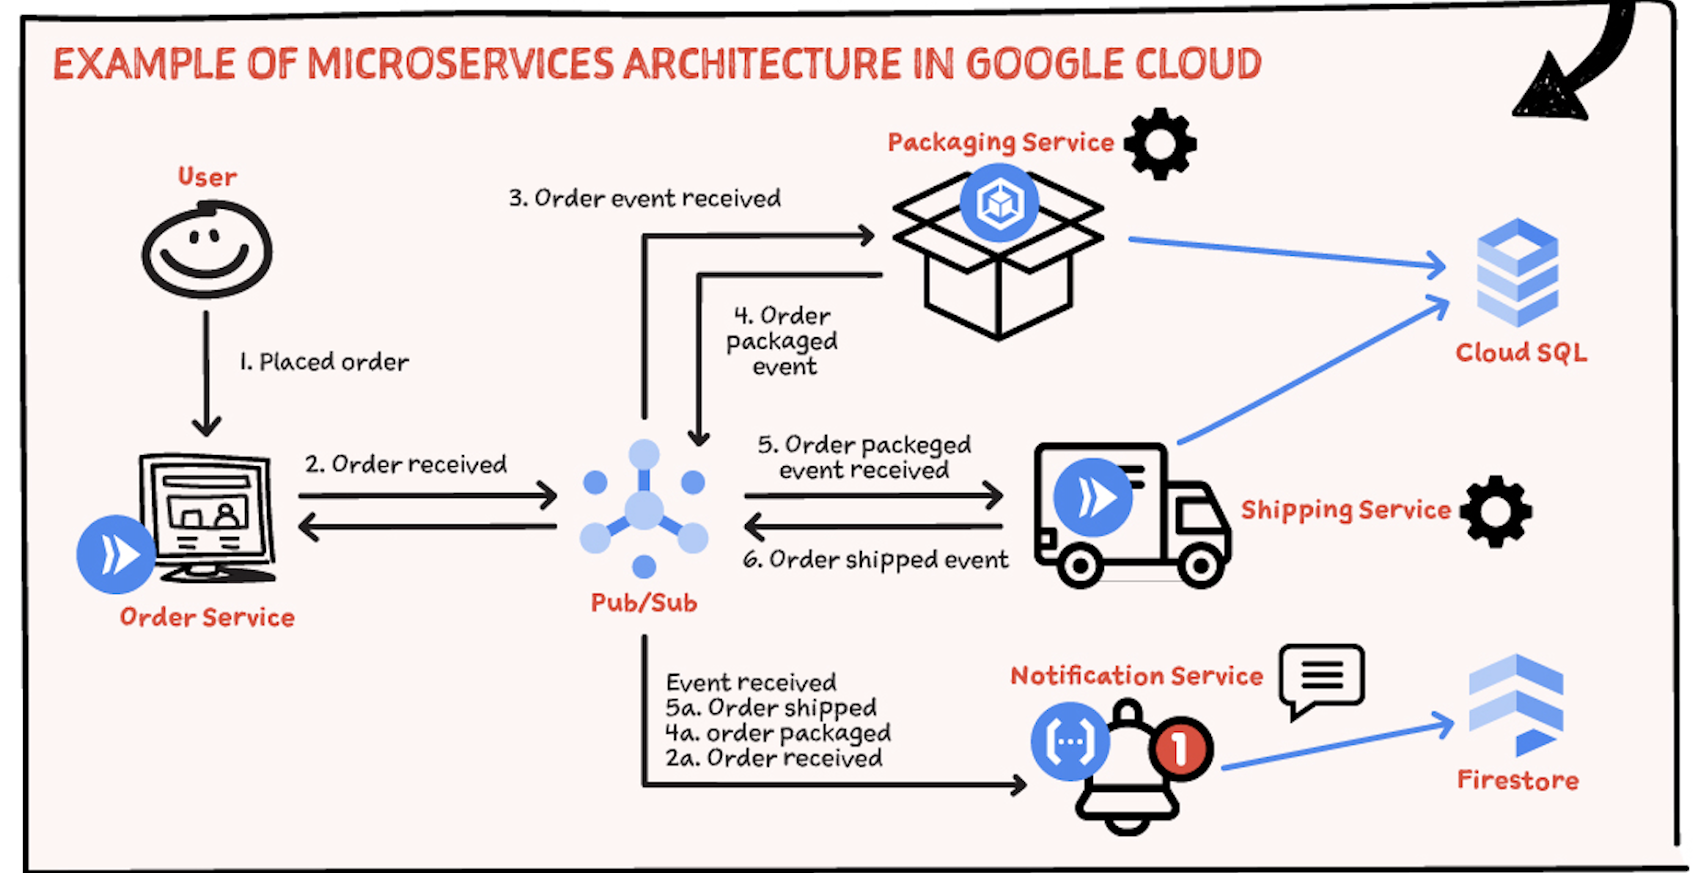
Learn
14 - N
Nginx
Note: Nginx is pronounced as “engine-ex”.
Nginx is an open-source web server that, since its initial success as a web server, is now also used as a reverse proxy, HTTP cache, and load balancer.
Some high-profile companies using Nginx include Autodesk, Atlassian, Intuit, T-Mobile, GitLab, DuckDuckGo, Microsoft, IBM, Google, Adobe, Salesforce, VMWare, Xerox, LinkedIn, Cisco, Facebook, Target, Citrix Systems, Twitter, Apple, Intel, and many more.
Nginx was originally created by Igor Sysoev, with its first public release in October 2004. Igor initially conceived the software as an answer to the C10k problem, which is a problem regarding the performance issue of handling 10,000 concurrent connections.
Because its roots are in performance optimization under scale, Nginx often outperforms other popular web servers in benchmark tests, especially in situations with static content and/or high concurrent requests.
How Does Nginx Work?
Nginx is built to offer low memory usage and high concurrency. Rather than creating new processes for each web request, Nginx uses an asynchronous, event-driven approach where requests are handled in a single thread.
With Nginx, one master process can control multiple worker processes. The master maintains the worker processes, while the workers do the actual processing. Because Nginx is asynchronous, each request can be executed by the worker concurrently without blocking other requests.
Benefits Of Using Nginx
-
Installations and configurations are simple and easy
-
Fastest and the best for serving static files
-
Compatibility with commonly-used web apps
-
Load Balancing Support
-
No risk in switching over to Nginx
-
Support from Nginx service professionals
14.1 - Nginx in GCP
Get High-Performance, High-Availability App Delivery with Nginx configured servers.

NGINX brings power and control to your Google Cloud Platform (GCP) environment so you can operate services and deliver content at the high standard your customers and developers demand.
NGINX Plus operates stand‑alone or can integrate with GCP services – such as existing load balancing solutions – to reduce your application delivery and management costs. NGINX Plus provides enterprise‑grade features such as session persistence, configuration via API, and active health checks so that you can add advanced application load balancing, monitoring, and management to your GCP application stack. Use Packer, Terraform, and NGINX Plus to implement high‑availability, all‑active, autoscaling solutions on Google Compute Engine.
Learn
15 - O
Observability
What is Observability?
In IT and cloud computing, observability is the ability to measure a system’s current state based on the data it generates, such as logs, metrics, and traces.
Observability relies on telemetry derived from instrumentation that comes from the endpoints and services in your multi-cloud computing environments. In these modern environments, every hardware, software, and cloud infrastructure component and every container, open-source tool, and microservice generates records of every activity. The goal of observability is to understand what’s happening across all these environments and among the technologies, so you can detect and resolve issues to keep your systems efficient and reliable and your customers happy.
Organizations usually implement observability using a combination of instrumentation methods including open-source instrumentation tools, such as OpenTelemetry.
Many organizations also adopt an observability solution to help them detect and analyze the significance of events to their operations, software development life cycles, application security, and end-user experiences.
Observability has become more critical in recent years, as cloud-native environments have gotten more complex and the potential root causes for a failure or anomaly have become more difficult to pinpoint. As teams begin collecting and working with observability data, they are also realizing its benefits to the business, not just IT.
Because cloud services rely on a uniquely distributed and dynamic architecture, observability may also sometimes refer to the specific software tools and practices businesses use to interpret cloud performance data. Although some people may think of observability as a buzzword for sophisticated application performance monitoring (APM), there are a few key distinctions to keep in mind when comparing observability and monitoring.
What is the difference between monitoring and observability?
Is observability really monitoring by another name? In short, no. While observability and monitoring are related — and can complement one another — they are actually different concepts.
In a monitoring scenario, you typically preconfigure dashboards that are meant to alert you to performance issues you expect to see later. However, these dashboards rely on the key assumption that you’re able to predict what kinds of problems you’ll encounter before they occur.
Cloud-native environments don’t lend themselves well to this type of monitoring because they are dynamic and complex, which means you have no way of knowing in advance what kinds of problems might arise.
In an observability scenario, where an environment has been fully instrumented to provide complete observability data, you can flexibly explore what’s going on and quickly figure out the root cause of issues you may not have been able to anticipate.
Benefits of observability
Observability delivers powerful benefits to IT teams, organizations, and end-users alike. Here are some of the use cases observability facilitates:
- Application performance monitoring: Full end-to-end observability enables organizations to get to the bottom of application performance issues much faster, including issues that arise from cloud-native and microservices environments. An advanced observability solution can also be used to automate more processes, increasing efficiency and innovation among Ops and Apps teams.
- DevSecOps and Site Reliability Engineering: Observability is not just the result of implementing advanced tools, but a foundational property of an application and its supporting infrastructure. The architects and developers who create the software must design it to be observed. Then DevSecOps and SRE teams can leverage and interpret the observable data during the software delivery life cycle to build better, more secure, more resilient applications. For the uninitiated, DevSecOps stands for development, security, and operations. It’s an approach to culture, automation, and platform design that integrates security as a shared responsibility throughout the entire IT lifecycle. Site reliability engineering (SRE) is a software engineering approach to IT operations.
- Infrastructure, cloud, and Kubernetes monitoring: Infrastructure and operations (I&O) teams can leverage the enhanced context an observability solution offers to improve application uptime and performance, cut down the time required to pinpoint and resolve issues, detect cloud latency issues and optimize cloud resource utilization, and improve administration of their Kubernetes environments and modern cloud architectures.
- End-user experience: A good user experience can enhance a company’s reputation and increase revenue, delivering an enviable edge over the competition. By spotting and resolving issues well before the end-user notices and making an improvement before it’s even requested, an organization can boost customer satisfaction and retention. It’s also possible to optimize the user experience through real-time playback, gaining a window directly into the end-user’s experience exactly as they see it, so everyone can quickly agree on where to make improvements.
- Business analytics: Organizations can combine business context with full stack application analytics and performance to understand real-time business impact, improve conversion optimization, ensure that software releases meet expected business goals, and confirm that the organization is adhering to internal and external SLAs.
DevSecOps teams can tap observability to get more insights into the apps they develop, and automate testing and CI/CD processes so they can release better quality code faster. This means organizations waste less time on war rooms and finger-pointing. Not only is this a benefit from a productivity standpoint, but it also strengthens the positive working relationships that are essential for effective collaboration.
What are the challenges of observability?
Observability has always been a challenge, but cloud complexity and the rapid pace of change has made it an urgent issue for organizations to address. Cloud environments generate a far greater volume of telemetry data, particularly when microservices and containerized applications are involved. They also create a far greater variety of telemetry data than teams have ever had to interpret in the past. Lastly, the velocity with which all this data arrives makes it that much harder to keep up with the flow of information, let alone accurately interpret it in time to troubleshoot a performance issue.
Organizations also frequently run into the following challenges with observability:
-
Data silos: — Multiple agents, disparate data sources, and siloed monitoring tools make it hard to understand interdependencies across applications, multiple clouds, and digital channels, such as web, mobile, and IoT.
-
Volume, velocity, variety, and complexity: — It’s nearly impossible to get answers from the sheer amount of raw data collected from every component in ever-changing modern cloud environments, such as AWS, Azure, and Google Cloud Platform (GCP). This is also true for Kubernetes and containers that can spin up and down in seconds.
-
Manual instrumentation and configuration: — When IT resources are forced to manually instrument and change code for every new type of component or agent, they spend most of their time trying to set up observability rather than innovating based on insights from observability data.
-
Lack of pre-production: — Even with load testing in pre-production, developers still don’t have a way to observe or understand how real users will impact applications and infrastructure before they push code into production.
-
Wasting time troubleshooting: — Application, operations, infrastructure, development, and digital experience teams are pulled in to troubleshoot and try to identify the root cause of problems, wasting valuable time guessing and trying to make sense of telemetry and come up with answers.
Also, not all types of telemetry data are equally useful for determining the root cause of a problem or understanding its impact on the user experience. As a result, teams are still left with the time-consuming task of digging for answers across multiple solutions and painstakingly interpreting the telemetry data, when they could be applying their expertise toward fixing the problem right away. However, with a single source of truth, teams can get answers and troubleshoot issues much faster.
15.1 - OpenMetrics
The de-facto standard for transmitting cloud-native metrics at scale.
Creating OpenMetrics within CNCF was a given.
- Richard “RichiH” Hartmann, director of community at Grafana Labs and OpenMetrics founder.
What is OpenMetrics?
It specifies the de-facto standard for transmitting cloud-native metrics at scale, with support for both text representation and Protocol Buffers. OpenMetrics is a Cloud Native Computing Foundation sandbox project.
OpenMetrics creates an open standard for transmitting cloud-native metrics at scale. It acts as an open standard for Prometheus and is the officially supported exposition format for the project and compatible solutions.
Metrics are a specific kind of telemetry data, and when combined with logs and traces, provide a comprehensive view of the performance of cloud native applications.
OpenMetrics was spun out of Prometheus to provide a specification and de-facto standard format for metrics.
It is used or supported by most CNCF projects and many wider cloud native ecosystem projects. Furthermore, any changes are considered closely with Cortex, Prometheus, Kubernetes, and Thanos.
OpenMetrics is used in production by many large enterprises, including GitLab, DoorDash, Grafana Labs, Chronosphere, Everquote, and SoundCloud.
OpenMetrics stems from the stats formats used inside of Prometheus and Google’s Monarch time-series infrastructure, which underpins both Stackdriver and internal monitoring applications.
Learn
Learn more about OpenMetrics from the official documentation
Learn more about Prometheus from the official documentation
15.2 - OpenTelemetry
An open-source standard for logs, metrics, and traces.
What is OpenTelemetry?
OpenTelemetry (also referred to as OTel) is an open-source observability framework made up of a collection of tools, APIs, and SDKs. Otel enables IT teams to instrument, generate, collect, and export telemetry data for analysis and to understand software performance and behavior.
Having a common format for how observability data is collected and sent is where OpenTelemetry comes into play. As a Cloud Native Computing Foundation (CNCF) incubating project, OTel aims to provide unified sets of vendor-agnostic libraries and APIs — mainly for collecting data and transferring it somewhere. Since the project’s start, many vendors have come on board to help make rich data collection easier and more consumable.
What is telemetry data?
Capturing data is critical to understanding how your applications and infrastructure are performing at any given time. This information is gathered from remote, often inaccessible points within your ecosystem and processed by some sort of tool or equipment. Monitoring begins here. The data is incredibly plentiful and difficult to store over long periods due to capacity limitations — a reason why private and public cloud storage services have been a boon to DevOps teams.
Logs, metrics, and traces make up the bulk of all telemetry data.
-
Logs are important because you’ll naturally want an event-based record of any notable anomalies across the system. Structured, unstructured, or in plain text, these readable files can tell you the results of any transaction involving an endpoint within your multicloud environment. However, not all logs are inherently reviewable — a problem that’s given rise to external log analysis tools.
-
Metrics are numerical data points represented as counts or measures that are often calculated or aggregated over a period of time. Metrics originate from several sources including infrastructure, hosts, and third-party sources. While logs aren’t always accessible, most metrics tend to be reachable via query. Timestamps, values, and even event names can preemptively uncover a growing problem that needs remediation.
-
Traces are the act of following a process (for example, an API request or other system activity) from start to finish, showing how services connect. Keeping a watch over this pathway is critical to understanding how your ecosystem works, if it’s working effectively, and if any troubleshooting is necessary. Span data is a hallmark of tracing — which includes information such as unique identifiers, operation names, timestamps, logs, events, and indexes.
How does OpenTelemetry work?
OTel is a specialized protocol for collecting telemetry data and exporting it to a target system. Since the CNCF project itself is open source, the end goal is making data collection more system-agnostic than it currently is. But how is that data generated?
The data life cycle has multiple steps from start to finish. Here are the steps the solution takes, and the data it generates along the way:
- Instruments your code with APIs, telling system components what metrics to gather and how to gather them
- Pools the data using SDKs, and transports it for processing and exporting
- Breaks down the data, samples it, filters it to reduce noise or errors, and enriches it using multi-source contextualization
- Converts and exports the data
- Conducts more filtering in time-based batches, then moves the data onward to a predetermined backend.
OpenTelemetry components
OTel consists of a few different components as depicted in the following figure. Let’s take a high-level look at each one from left to right:

OpenTelemetry Components
APIs
These are core components and language-specific (such as Java, Python, .Net, and so on). APIs provide the basic “plumbing” for your application.
SDK
This is also a language-specific component and is the middleman that provides the bridge between the APIs and the exporter. The SDK allows for additional configuration, such as request filtering and transaction sampling.
In-process exporter
This allows you to configure which backend(s) you want it sent to. The exporter decouples the instrumentation from the backend configuration. This makes it easy to switch backends without the pain of re-instrumenting your code.
Collector
The collector receives, processes, and exports telemetry data. While not technically required, it is an extremely useful component to the OpenTelemetry architecture because it allows greater flexibility for receiving and sending the application telemetry to the backend(s).
The collector has two deployment models:
- An agent that resides on the same host as the application (for example, binary, DaemonSet, sidecar, and so on)
- A standalone process completely separate from the application
Since the collector is just a specification for collecting and sending telemetry, it still requires a backend to receive and store the data.
Benefits of OpenTelemetry
OTel provides a de facto standard for adding observable instrumentation to cloud-native applications. This means companies don’t need to spend valuable time developing a mechanism for collecting critical application data and can spend more time delivering new features instead.
It’s akin to how Kubernetes became the standard for container orchestration. This broad adoption has made it easier for organizations to implement container deployments since they don’t need to build their own enterprise-grade orchestration platform. Using Kubernetes as the analog for what it can become, it’s easy to see the benefits it can provide to the entire industry.
Learn
Learn more about OpenTelemetry from the official documentation
15.3 - OpenTracing
An initiative to enable reusable, open source, vendor neutral instrumentation for distributed tracing.
Ideas about distributed tracing and monitoring across multiple systems have certainly generated quite a buzz. It’s becoming more important than ever before to be able to see what’s going on inside our requests as they span across multiple software services. Aiming to harness this importance, the OpenTracing initiative has sprung up to help developers avoid vendor lock-in.
What Is Distributed Tracing?
Distributed tracing is a mechanism you can use to profile and monitor applications. Unlike regular tracing, distributed tracing is more suited to applications built using a microservice architecture, hence the name.
Distributed tracing tracks a single request through all of its journey, from its source to its destination, unlike traditional forms of tracing which just follow a request through a single application domain.
In other words, we can say that distributed tracing is the stitching of multiple requests across multiple systems. The stitching is often done by one or more correlation IDs, and the tracing is often a set of recorded, structured log events across all the systems, stored in a central place.
What is OpenTracing?
It’s a vendor-agnostic API to help developers easily instrument tracing into their code base. It’s open because no one company owns it.
OpenTracing wants to form a common language around what a trace is and how to instrument them in our applications. In OpenTracing, a trace is a directed acyclic graph of Spans with References that may look like this

This allows us to model how our application calls out to other applications, internal functions, asynchronous jobs, etc. All of these can be modeled as Spans, as we’ll see below.
For example, if I have a consumer website where a customer places orders, I make a call to my payment system and my inventory system before asynchronously acknowledging the order. I can trace the entire order process through every system with an OpenTracing library and can render it like this:

Each one of these bracketed blocks is a Span representing a separate software system communicating over messaging or HTTP.
Terminology
Let’s talk a bit about the components of the OpenTracing API.
-
Tracer
This tracer is the entry point into the tracing API. It gives us the ability to create Spans. It also lets us extract tracing information from external sources and inject information to external destinations.
-
Span
This represents a unit of work in the Trace. For example, a web request that initiates a new Trace is called the root Span. If it calls out to another web service, that HTTP request would be wrapped within a new child Span. Spans carry around a set of tags of information pertinent to the request being carried out. You can also log events within the context of a Span. They can support more complex workflows than web requests, such as asynchronous messaging. They have timestamps attached to them so we can easily construct a timeline of events for the Trace.
-
SpanContext
The SpanContext is the serializable form of a Span. It lets Span information transfer easily across the wire to other systems.
-
References
So far, Spans can connect to each other via two types of relationship: ChildOf and FollowsFrom. ChildOf Spans are spans like in our previous example, where our ordering website sent child requests to both our payment system and inventory system. FollowsFrom Spans are just a chain of sequential Spans. So, a FollowsFrom Span is just saying, “I started after this other Span.”
Is OpenTracing still in Use?
OpenTracing is an open-source CNCF (Cloud Native Computing Foundation) project which provides vendor-neutral APIs and instrumentation for distributed tracing. Although OpenTracing and OpenCensus have merged to form OpenTelemetry in early 2019, third-party libraries and frameworks like Hazelcast IMDG still come equipped with OpenTracing pre-instrumentation.
OpenTracing became a CNCF project back in 2016, with the goal of providing a vendor-agnostic specification for distributed tracing, offering developers the ability to trace a request from start to finish by instrumenting their code. Then, Google made the OpenCensus project open source in 2018. This was based on Google’s Census library that was used internally for gathering traces and metrics from their distributed systems. Like the OpenTracing project, the goal of OpenCensus was to give developers a vendor-agnostic library for collecting traces and metrics.
This led to two competing tracing frameworks, which led to the informal reference “the Tracing Wars.” Usually, competition is a good thing for end-users since it breeds innovation. However, in the open-source specification world, competition can lead to poor adoption, contribution, and support.
Going back to the Kubernetes example, imagine how much more disjointed and slow-moving container adoption would be if everybody was using a different orchestration solution. To avoid this, it was announced at KubeCon 2019 in Barcelona that the OpenTracing and OpenCensus projects would converge into one project called OpenTelemetry and join the CNCF.
Learn
Learn more about OpenTracing from the official documentation
16 - P
If you’re an application developer you should be playing with PaaS now. (Organizations) are doing your developers a disservice if they’re not playing with PaaS.
- Steven Pousty, Developer Experience Engineer, Tanzu - VMWare
Platform-as-a-Service (PaaS) provides a cloud-based platform for developing, deploying, and managing applications. In contrast to the IaaS offering such as Google Compute Engine, the developer does not have to directly manage, configure the underlying hardware to develop their applications. For a PaaS, the cloud services provider hosts, manages, and maintains all the hardware and software included in the platform - servers (for development, testing and deployment), operating system (OS) software, storage, networking, databases, middleware, runtime, frameworks, development tools - as well as related services for security, operating system and software upgrades, backups and more.
Benefits of PaaS
-
Faster time to market: PaaS enables development teams to spin-up development, testing and production environments in minutes, vs. weeks or months.
-
Low to no-risk testing and adoption of new technologies: PaaS platforms typically include access to a wide range of the latest resources up and down the application stack. This allows companies to test new operating systems, languages, and other tools without having to make substantial investments in them, or in the infrastructure required to run them.
-
Simplified collaboration: As a cloud-based service, PaaS provides a shared software development environment, giving development and operations teams access to all the tools they need, from anywhere with an Internet connection.
-
A more scalable approach: With PaaS, organizations can purchase additional capacity for building, testing, staging and running applications whenever they need it.
Less to manage: PaaS offloads infrastructure management, patches, updates and other administrative tasks to the cloud service provider.
IaaS or PaaS?
Here’s how you can decide which service to choose for building your application:
The following graphic shows the different resources to be managed when developing on-premises, i.e., developing with one’s own infrastructure, IaaS, or PaaS.

Depending upon how much control a developer needs on the infrastructure, the right service can be chosen.

Try PaaS
The easiest way for a student developer to get started with using cloud is by deploying and managing their application on a PaaS offering.
-
Google Cloud’s PaaS offering has been covered in App Engine under the Automation section.
-
One of the most widely used PaaS offerings is Heroku by Salesforce.
-
OpenShift by Red Hat is widely used by enterprises as it provides container orchestration services as well.
17 - Q
Quality Assurance
Quality is more important than quantity. One home run is much better than two doubles.
- Steve Jobs, CEO, Apple Inc.
Quality assurance (QA) is any systematic process of determining whether a product or service meets specified requirements.
QA establishes and maintains set requirements for developing or manufacturing reliable products. A quality assurance system is meant to increase customer confidence and a company’s credibility, while also improving work processes and efficiency, and it enables a company to better compete with others.
What happened when Quality Assurance was not taken seriously?
1986 Challenger Space Shuttle explosion
-
On January 28, 1986, the NASA Shuttle Challenger exploded minutes after take-off, resulting in the tragic death of all seven astronauts on board.
-
The Reason for this was the hardware failure occurred due to lack of quality assurance checks.
The Ford Pinto revs, and quite possibly blows, up
-
In response to competition from Japanese imports, Ford released the Pinto in 1971 – a populist automotive icon that looked to capture consumer hearts with its $2,000 price-tag.
-
The Pinto’s aesthetic quality was always in question. In 1977, however, lawsuits emerged on the back of allegations of a structural design fault. The fuel tank was understood to be in close proximity to the rear bumper and rear axle, meaning that rear-end collisions would elevate the risk of fires.
-
Ford’s decision to recall 1.4 million units in 1978 saved no face, as investigate journalist Mark Dowie revealed that Ford had been aware of the design flaw during production. He published a cost-benefit analysis document that saw Ford compare the cost of $11 per-vehicle repairs with the cost of settlements for deaths, injuries and burnouts.
-
The subcompact car was decommissioned in 1980, but the vehicle has been the source of historical discourse. Revisionists point to the success of selling 3 million units, and claim that fresh examinations of incident data rank the Pinto as safe, or safer than, cars in the same class. Regardless, Ford’s callous cost-benefit analysis left a legacy of crooked corporate culture.
and many more examples…
What quality assurance does?
-
Quality assurance helps a company create products and services that meet the needs, expectations and requirements of customers.
-
It yields high-quality product offerings that build trust and loyalty with customers.
-
The standards and procedures defined by a quality assurance program help prevent product defects before they arise.
17.1 - Visual Inspection AI
A purpose-built solution for faster, more accurate quality control
The Google Cloud Visual Inspection AI solution automates visual inspection tasks using a set of AI and computer vision technologies that enable manufacturers to transform quality control processes by automatically detecting product defects.
Here’s a demo use-case in the chip manufacturing industry:

Other Use-cases
Automotive manufacturing: Paint shop surface inspection, body shop welding seam inspection, press shop inspection (scratch, dents, cracks, staining), foundry engine block inspection (cracks, deformation, anomaly)
Semiconductor manufacturing: Wafer level anomaly and defect localization, die crack inspection, pre-place inspection, SoC packaging inspection, board assembly inspection
Electronics manufacturing: Defective or missing printed circuit board (PCB) components (screw, spring, foam, connector, shield, etc.), PCB soldering and gluing (insufficient solder, Icicle, shift, exceeding tin, etc.), product surface check (glue spill, mesh deformation, scratches, bubbles, etc.)
General-purpose manufacturing: Packaging and label inspection, fabric inspection (mesh, tear, yarn), metal and plastic welding seam inspection, surface inspection
Learn
Learn more about Visual Inspection AI
18 - R
Reliability
As the adoption of cloud computing continues to rise, and customers demand 24/7 access to their services and data, reliability remains a challenge for cloud service providers everywhere. It’s not a matter of if an outage will occur; it’s strictly a matter of when. This means it’s critical for organizations to understand how best to design and deliver reliable cloud services.
What is reliability in cloud computing?
When you access an app or service in the cloud, you can reasonably expect that:
- The app or service is up and running.
- You can access what you need from any device at any time from any location.
- There will be no interruptions or downtime.
- Your connection is secure.
- You will be able to perform the tasks you need to get your job done.
Reliability refers to the probability that the system will meet certain performance standards in yielding correct output for a desired time duration.
Reliability can be used to understand how well the service will be available in context of different real-world conditions. For instance, a cloud solution may be available with a Service Level Agreement (SLA) commitment of 99.999 percent, but vulnerabilities to sophisticated cyber-attacks may cause IT outages beyond the control of the vendor. As a result, the service may be compromised for several days, thereby reducing the effective availability of the IT service.
How can you measure Reliability?
In an ideal world, your system would be 100% reliable. But that is probably not an attainable goal. In the real world, things will go wrong. You will see faults from things such as server downtime, software failure, security breaches, user errors, and other unexpected incidents.
The Reliability of a system is challenging to measure. There may be several ways to measure the probability of failure of system components that impact the availability of the system.
A common metric is to calculate the Mean Time Between Failures (MTBF).
MTBF = (total elapsed time – sum of downtime)/number of failures
MTBF represents the time duration between a component failure of the system. Similarly, organizations may also evaluate the Mean Time To Repair (MTTR), a metric that represents the time duration to repair a failed system component such that the overall system is available as per the agreed SLA commitment.
Other ways to measure reliability may include metrics such as fault tolerance levels of the system. Greater the fault tolerance of a given system component, lower is the susceptibility of the overall system to be disrupted under changing real-world conditions.
The measurement of Reliability is driven by the frequency and impact of failures.
For either metric, organizations need to make decisions on how much time loss and frequency of failures they can bear without disrupting the overall system performance for end-users. Similarly, they need to decide how much they can afford to spend on the service, infrastructure and support to meet certain standards of availability and reliability of the system.
How To Achieve Reliability In The Cloud?
If we accept the fact failures will occur, then the outcomes that organizations may want to consider in relation to their cloud services, fall into four main categories:
- Maximize service availability to customers.
Make sure the service does what the customer wants, when they want it, as much of the time as possible.
- Minimize the impact of any failure on customers.
Assume something will go wrong and design the service in a way that it will be the non-critical components that fail first; the criticalcomponents keep working. Isolate the failure as much as possible so the minimum number of customers is impacted. And if the service goes down completely, focus on reducing the amount of time any one customer cannot use the service at all.
- Maximize service performance.
Reduce the impact to customers at times when performance may be negatively impacted, such as during an unexpected spike in traffic.
- Maximize business continuity.
Focus on how the organization and the service respond when a failure occurs. Automate recovery where possible and disaster recovery drills should be carried out to ensure the organization is fully prepared to deal with the inevitable failure.
However, there are three best practices for reliability in the cloud. Following these practices may negate some or all of the scenarios listed above:
- Foundations
- Change Management
- Failure Management
To achieve reliability, a system must have a well-planned foundation and monitoring in place, with mechanisms for handling changes in demand or requirements. The system should be designed to detect failure and automatically heal itself.
Foundations
Before architecting any system, foundational requirements that influence reliability should be in place. For example, you must have sufficient network bandwidth to your data centre. These requirements are sometimes neglected (because they are beyond a single project’s scope). This neglect can have a significant impact on the ability to deliver a reliable system. In an on-premises environment, these requirements can cause long lead times due to dependencies and therefore must be incorporated during initial planning.
Change Management
Being aware of how change affects a system allows you to plan proactively, and monitoring allows you to quickly identify trends that could lead to capacity issues or SLA breaches. In traditional environments, change-control processes are often manual and must be carefully coordinated with auditing to effectively control who makes changes and when they are made.
Failure Management
In any system of reasonable complexity, it is expected that failures will occur. It is generally of interest to know how to become aware of these failures, respond to them, and prevent them from happening again.
Regularly back up your data and test your backup files to ensure you can recover from both logical and physical errors. A key to managing failure is the frequent and automated testing of systems to cause failure, and then observe how they recover. Do this on a regular schedule and ensure that such testing is also triggered after significant system changes.
The objective is to thoroughly test your system-recovery processes so that you are confident that you can recover all your data and continue to serve your customers, even in the face of sustained problems. Your recovery processes should be as well exercised as your normal production processes.
How reliable is Google Cloud?
Nothing is 100% reliable. When designing application architecture, you have to assume there will be failures. Historically, this has meant deploying across racks, rooms and data centres to ensure that local switch, power and geographic incidents do not affect your entire infrastructure.
When deploying on the cloud, this translates to deploying across zones and regions. A zone is supposed to be isolated from other zones but close enough to allow low latency and low cost networking. However, since zones are close by, they are still susceptible to geographic events e.g. Storms. That’s why you deploy across multiple regions. For complete redundancy, provider diversity is the ultimate goal.
Because each zone is an independent entity, zone failures do not affect other zones.
From the latest Outage, we can see that Google has added multiple layers of protection that were not present in previous outages. These include:
- Automation: Using tools to apply configuration changes makes it easy to do them consistently and repeatedly. You mitigate human errors such as typos or incorrect configurations.
- Verification: Google has software which not only generates the config but also verifies it. The problem is the most recent outage was that although the verification step discovered the problems, the rollout was not aborted due to bugs in the rollout process.
- Staged rollouts: The incident actually began several hours before the global impact was seen. Past outages have seen changes applied globally at the same time but now changes are rolled out gradually. Unfortunately this didn’t help because although alerts were generated, their investigation took longer than it took to complete the global rollout.
- Canaries: Rolling out changes to a small set of the entire infrastructure allows you to observe the impact in production. This step is absent from previous Google outages but is now a specific step. Unfortunately, although the canary deploy did show the problem, the rollout was not aborted due to a separate software bug.
Google Compute Engine guarantees 99.95% uptime which equates to 4 hours and 23 minutes of downtime per year.
19 - S
Scalability
Simply put, scalability refers to the ability to increase or decrease compute resources to meet changing demand or load.
Several Google Cloud Platform services such as Cloud Run and Cloud Functions automatically scale up or down depending upon changing demands.
Horizontal and Vertical Scaling

In the early 2000s or before cloud computing became accessible to an individual, a website would typically be hosted on a Linux machine, exposed to the internet via an IP address, and networking handled by an Apache or Nginx server. Thus, the web application was deployed on-premises. Say this web app is Facebook, which was first deployed on a server belonging to Harvard University in the US.
Vertical scaling
Soon the social media platform becomes a hit and the standalone server cannot handle the increased demand. A more powerful machine/server is needed that can run the same copy of code for the web app. Thus, the infrastructure needed to scale up with the changing demand; this kind of scaling is called as vertical scaling, where more compute resources are added to the same machine such as RAM or storage.
External storage can easily be added to a running machine. However, as RAM cannot be added externally, the machine first needs to be shut down and the existing RAM needs to be replaced with a larger RAM. This means that the website will no longer be available to anyone and there will be a disruption of service.
Horizontal scaling
Now students outside the Harvard University campus are using Facebook, as far as in the UK! Their requests and data are all managed in this one big machine at Harvard University. With a further increase in load and unavailability of an even powerful machine, what can be done? If not a more powerful machine, a smaller machine that can run the same instance of the web app can be used. Here, the infrastructure is scaled out and this kind of scaling is called as horizontal scaling.
An entire new machine needs to be purchased/rented and configured for the web app to be run on it. Thus, the cost increases exponentially as more and more machines are used.
Comparison
| Horizontal Scaling |
Vertical Scaling |
| A load balancer such as Nginx is required to route incoming requests to multiple servers |
Since there is only one machine, all the load is bear by it and no load balancer is needed |
| Reliable as failure of one server does not affect other servers |
Single point of failure as there is only one server |
| If a shared database is being used, data consistency needs to be taken care of |
No issue of data inconsistency |
| Scales out without any disruption of service |
Scales up with downtime depending upon compute resource to be added |
| Cost increases exponentially |
Cost increase linearly |
| Desirable for a microservices architecture |
Desirable for a monolithic architecture |
20 - T
Telemetry
Data is the new oil.
- Clive Humby
Telemetry is the automatic recording and transmission of data from remote or inaccessible sources to an IT system in a different location for monitoring and analysis. Telemetry data may be relayed using radio, infrared, ultrasonic, GSM, satellite or cable, depending on the application (telemetry is not only used in software development, but also in meteorology, intelligence, medicine, and other fields).
In the software development world, telemetry can offer insights on which features end users use most, detection of bugs and issues, and offering better visibility into performance without the need to solicit feedback directly from users.
How Telemetry Works?
In a general sense, telemetry works through sensors at the remote source which measures physical (such as precipitation, pressure or temperature) or electrical (such as current or voltage) data. This is converted to electrical voltages that are combined with timing data. They form a data stream that is transmitted over a wireless medium, wired or a combination of both.
At the remote receiver, the stream is disaggregated and the original data displayed or processed based on the user’s specifications.
In the context of software development, the concept of telemetry is often confused with logging. But logging is a tool used in the development process to diagnose errors and code flows, and it’s focused on the internal structure of a website, app, or another development project. Once a project is released, however, telemetry is what you’re looking for to enable automatic collection of data from real-world use. Telemetry is what makes it possible to collect all that raw data that becomes valuable, actionable analytics.
Benefits of Telemetry
The primary benefit of telemetry is the ability of an end user to monitor the state of an object or environment while physically far remote from it. Once you’ve shipped a product, you can’t be physically present, peering over the shoulders of thousands (or millions) of users as they engage with your product to find out what works, what’s easy, and what’s cumbersome. Thanks to telemetry, those insights can be delivered directly into a dashboard for you to analyze and act on.
Because telemetry provides insights into how well your product is working for your end users – as they use it – it’s an incredibly valuable tool for ongoing performance monitoring and management. Plus, you can use the data you’ve gathered from version 1.0 to drive improvements and prioritize updates for your release of version 2.0.
Telemetry enables you to answer questions such as:
-
Are your customers using the features you expect? How are they engaging with your product?
-
How frequently are users engaging with your app, and for what duration?
-
What settings options to users select most? Do they prefer certain display types, input modalities, screen orientation, or other device configurations?
-
What happens when crashes occur? Are crashes happening more frequently when certain features or functions are used? What’s the context surrounding a crash?
Obviously, the answers to these and the many other questions that can be answered with telemetry are invaluable to the development process, enabling you to make continuous improvements and introduce new features that, to your end users, may seem as though you’ve been reading their minds – which you have been, thanks to telemetry.
Challenges of Telemetry
Telemetry is clearly a fantastic technology, but it’s not without its challenges. The most prominent challenge – and a commonly occurring issue – is not with telemetry itself, but with your end users and their willingness to allow what some see as Big Brother-esque spying. In short, some users immediately turn it off when they notice it, meaning any data generated from their use of your product won’t be gathered or reported.
That means the experience of those users won’t be accounted for when it comes to planning your future roadmap, fixing bugs, or addressing other issues in your app. Although this isn’t necessarily a problem by itself, the issue is that users who tend to disallow these types of technologies can tend to fall into the more tech-savvy portion of your user base. According to Jack Schofield, can result in the dumbing-down of software. Other users, on the other hand, take no notice to telemetry happening behind the scenes or simply ignore it if they do.
It’s a problem without a clear solution — and it doesn’t negate the overall power of telemetry for driving development — but one to keep in mind as you analyze your data.
20.1 - OpenTelemetry
An open-source standard for logs, metrics, and traces.
What is OpenTelemetry?
OpenTelemetry (also referred to as OTel) is an open-source observability framework made up of a collection of tools, APIs, and SDKs. Otel enables IT teams to instrument, generate, collect, and export telemetry data for analysis and to understand software performance and behavior.
Having a common format for how observability data is collected and sent is where OpenTelemetry comes into play. As a Cloud Native Computing Foundation (CNCF) incubating project, OTel aims to provide unified sets of vendor-agnostic libraries and APIs — mainly for collecting data and transferring it somewhere. Since the project’s start, many vendors have come on board to help make rich data collection easier and more consumable.
What is telemetry data?
Capturing data is critical to understanding how your applications and infrastructure are performing at any given time. This information is gathered from remote, often inaccessible points within your ecosystem and processed by some sort of tool or equipment. Monitoring begins here. The data is incredibly plentiful and difficult to store over long periods due to capacity limitations — a reason why private and public cloud storage services have been a boon to DevOps teams.
Logs, metrics, and traces make up the bulk of all telemetry data.
-
Logs are important because you’ll naturally want an event-based record of any notable anomalies across the system. Structured, unstructured, or in plain text, these readable files can tell you the results of any transaction involving an endpoint within your multicloud environment. However, not all logs are inherently reviewable — a problem that’s given rise to external log analysis tools.
-
Metrics are numerical data points represented as counts or measures that are often calculated or aggregated over a period of time. Metrics originate from several sources including infrastructure, hosts, and third-party sources. While logs aren’t always accessible, most metrics tend to be reachable via query. Timestamps, values, and even event names can preemptively uncover a growing problem that needs remediation.
-
Traces are the act of following a process (for example, an API request or other system activity) from start to finish, showing how services connect. Keeping a watch over this pathway is critical to understanding how your ecosystem works, if it’s working effectively, and if any troubleshooting is necessary. Span data is a hallmark of tracing — which includes information such as unique identifiers, operation names, timestamps, logs, events, and indexes.
How does OpenTelemetry work?
OTel is a specialized protocol for collecting telemetry data and exporting it to a target system. Since the CNCF project itself is open source, the end goal is making data collection more system-agnostic than it currently is. But how is that data generated?
The data life cycle has multiple steps from start to finish. Here are the steps the solution takes, and the data it generates along the way:
- Instruments your code with APIs, telling system components what metrics to gather and how to gather them
- Pools the data using SDKs, and transports it for processing and exporting
- Breaks down the data, samples it, filters it to reduce noise or errors, and enriches it using multi-source contextualization
- Converts and exports the data
- Conducts more filtering in time-based batches, then moves the data onward to a predetermined backend.
OpenTelemetry components
OTel consists of a few different components as depicted in the following figure. Let’s take a high-level look at each one from left to right:
OpenTelemetry Components
APIs
These are core components and language-specific (such as Java, Python, .Net, and so on). APIs provide the basic “plumbing” for your application.
SDK
This is also a language-specific component and is the middleman that provides the bridge between the APIs and the exporter. The SDK allows for additional configuration, such as request filtering and transaction sampling.
In-process exporter
This allows you to configure which backend(s) you want it sent to. The exporter decouples the instrumentation from the backend configuration. This makes it easy to switch backends without the pain of re-instrumenting your code.
Collector
The collector receives, processes, and exports telemetry data. While not technically required, it is an extremely useful component to the OpenTelemetry architecture because it allows greater flexibility for receiving and sending the application telemetry to the backend(s).
The collector has two deployment models:
- An agent that resides on the same host as the application (for example, binary, DaemonSet, sidecar, and so on)
- A standalone process completely separate from the application
Since the collector is just a specification for collecting and sending telemetry, it still requires a backend to receive and store the data.
Benefits of OpenTelemetry
OTel provides a de facto standard for adding observable instrumentation to cloud-native applications. This means companies don’t need to spend valuable time developing a mechanism for collecting critical application data and can spend more time delivering new features instead.
It’s akin to how Kubernetes became the standard for container orchestration. This broad adoption has made it easier for organizations to implement container deployments since they don’t need to build their own enterprise-grade orchestration platform. Using Kubernetes as the analog for what it can become, it’s easy to see the benefits it can provide to the entire industry.
Learn
Learn more about OpenTelemetry from the official documentation
21 - U
URL Shortener
URL shortening has evolved into one of the main practices for the easy dissemination and sharing of URLs. URL shortening services provide their users with a smaller equivalent of any provided long URL, and redirect subsequent visitors to the intended source.
Why do we need URL shortening?
URL shortening is used to create shorter aliases for long URLs. We call these shortened aliases “short links.” Users are redirected to the original URL when they hit these short links. Short links save a lot of space when displayed, printed, messaged, or tweeted. Additionally, users are less likely to mistype shorter URLs.
For example, if we shorten the following URL through TinyURL:
https://dsc-vjti.github.io/a-z-cloud/docs/l/cloud-load-balancing/
We would get:
https://tinyurl.com/d3ewc7u9
The shortened URL is nearly one-third the size of the actual URL.
System Design goals
Functional Requirements:
- Given a URL, our service should generate a shorter and unique alias of it. This is called a short link. This link should be short enough to be easily copied and pasted into applications.
- When users access a short link, our service should redirect them to the original link.
- Users should optionally be able to pick a custom short link for their URL.
- Links will expire after a standard default timespan. Users should be able to specify the expiration time.
Non-Functional Requirements:
- The system should be highly available. This is required because, if our service is down, all the URL redirections will start failing.
- URL redirection should happen in real-time with minimal latency.
- Shortened links should not be guessable (not predictable).
Traffic and System Capacity
Traffic
Assuming 200:1 read/write ratio,
Number of unique shortened links generated per month = 100 million
Number of unique shortened links generated per seconds = 100 million /(30 days * 24 hours * 3600 seconds ) ~ 40 URLs/second
With 200:1 read/write ratio, number of redirections = 40 URLs/s * 200 = 8000 URLs/s
Storage
Assuming lifetime of service to be 100 years and with 100 million shortened links creation per month, total number of data points/objects in system will be = 100 million/month * 100 (years) * 12 (months) = 120 billion
Assuming size of each data object (Short url, long url, created date etc.) to be 500 bytes long, then total require storage = 120 billion * 500 bytes =60TB
Memory
Following Pareto Principle, better known as the 80:20 rule for caching. (80% requests are for 20% data)
Since we get 8000 read/redirection requests per second, we will be getting 700 million requests per day:
8000/s * 86400 seconds =~700 million
To cache 20% of these requests, we will need ~70GB of memory.
0.2 * 700 million * 500 bytes = ~70GB
High Level Design
Following is high level design of our URL service. This is a rudimentary design which needs to be optimized.
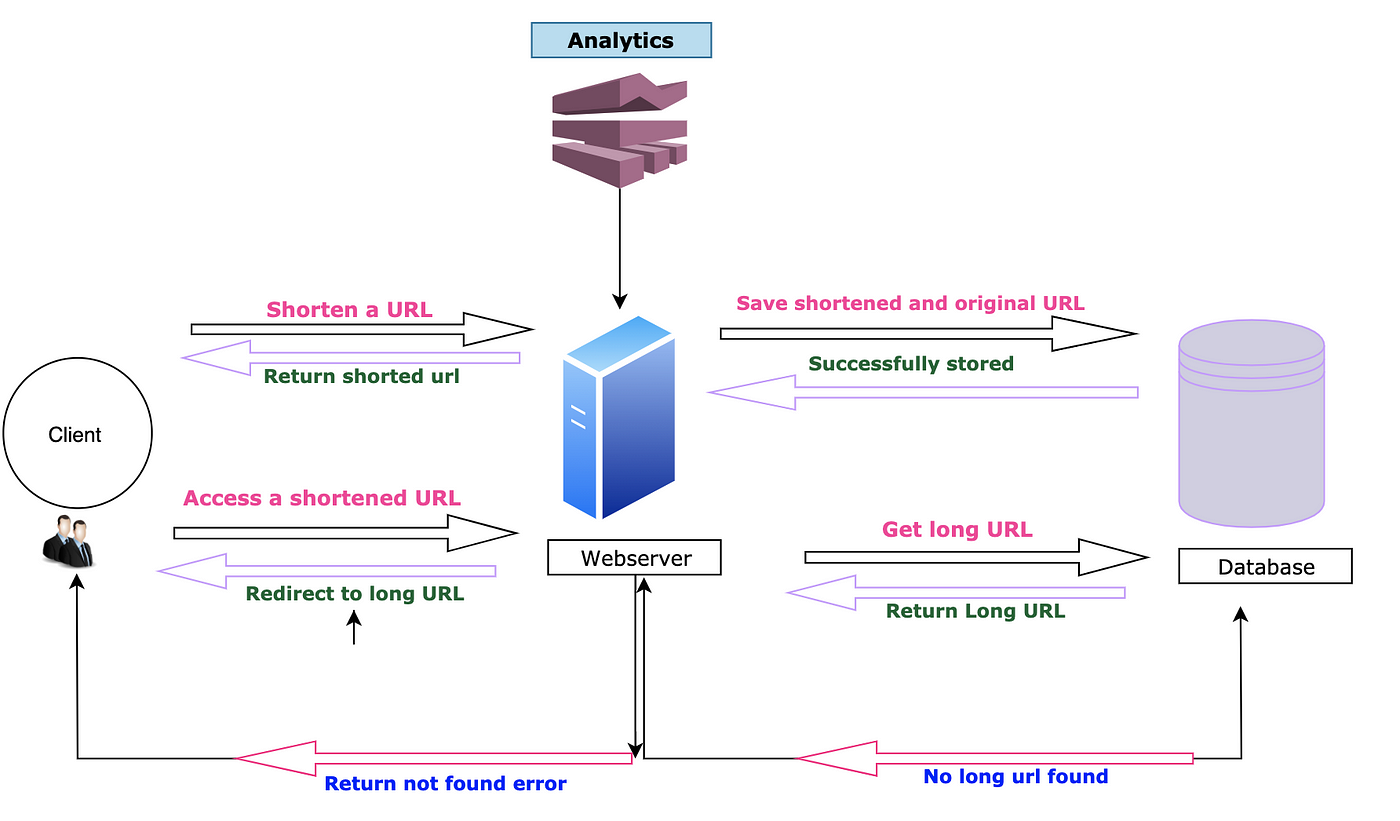
A Rudimentary design for URL service
Problems with above design :
- There is only one WebServer which is single point of failure (SPOF)
- System is not scalable
- There is only single database which might not be sufficient for 60 TB of storage and high load of 8000/s read requests
To cater to the above limitations we:
- Added a load balancer in front of WebServers
- Sharded the database to handle huge object data
- Added cache system to reduce load on the database.
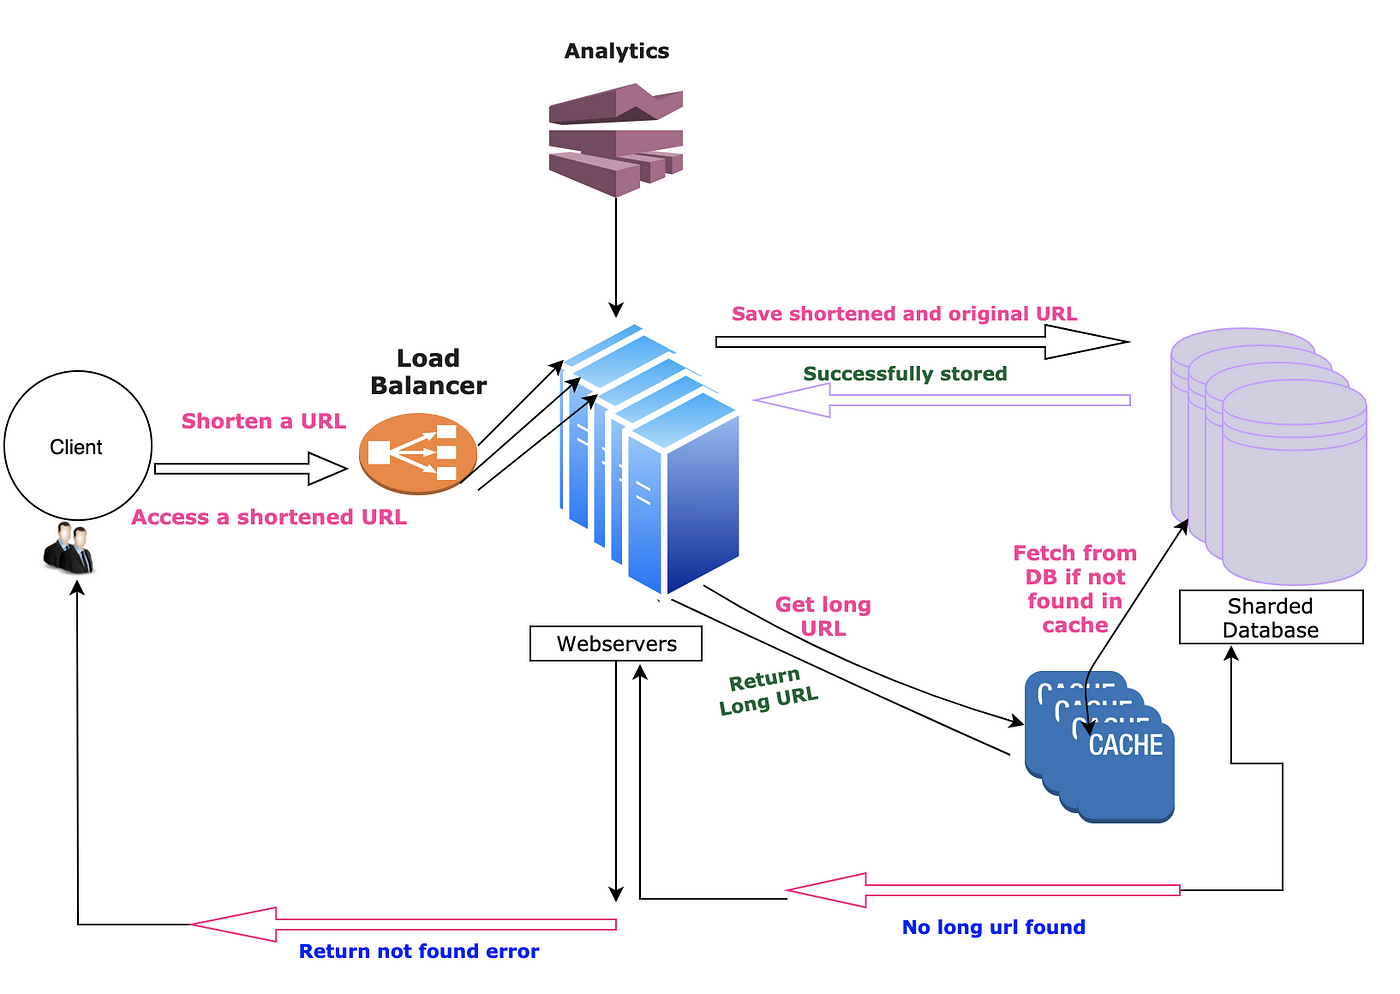
Scalable high level design
REST Endpoints
Let’s starts by making two functions accessible through REST API:
create( long_url, api_key, custom_url)
POST
Tinyrl : POST :https://tinyurl.com/app/api/create
Request Body: {url=long_url}
Return OK (200), with the generated short_url in data.
long_url: A long URL that needs to be shortened.
api_key: A unique API key provided to each user, to protect from the spammers, access, and resource control for the user, etc.
custom_url(optional): The custom short link URL, user want to use.
Return Value: The short Url generated, or error code in case of the inappropriate parameter.
GET: /{short_url}
Return a http redirect response(302)
Note : “HTTP 302 Redirect” status is sent back to the browser instead of “HTTP 301 Redirect”. A 301 redirect means that the page has permanently moved to a new location. A 302 redirect means that the move is only temporary. Thus, returning 302 redirect will ensure all requests for redirection reaches to our backend and we can perform analytics (Which is a functional requirement)
short_url: The short URL generated from the above function.
Return Value: The original long URL, or invalid URL error code.
Database Schema
Let’s see the data we need to store:
Data Related to user
- User ID: A unique user id or API key to make user globally distinguishable
- Name: The name of the user
- Email: The email id of the user
- Creation Date: The date on which the user was registered
Data Related to ShortLink
- Short Url: 6/7 character long unique short URL
- Original Url: The original long URL
- UserId: The unique user id or API key of the user who created the short URL
Shortening Algorithm
For shortening a url we can use following two solutions (URL encoding and Key Generation service). Let’s walk through each of them one by one.
- URL Encoding
a. URL encoding through base62
b. URL encoding through MD5
- Key Generation Service (KGS)
URL encoding through base62
A base is a number of digits or characters that can be used to represent a particular number.
Base 10 are digits [0–9], which we use in everyday life and
base 62 are [0–9][a-z][A-Z]
Let’s do a back of the envelope calculation to find out how many characters shall we keep in our tiny url.
URL with length 5, will give 62⁵ = ~916 Million URLs
URL with length 6, will give 62⁶ = ~56 Billion URLs
URL with length 7, will give 62⁷ = ~3500 Billion URLs
Since we required to produce 120 billion URLs, with 7 characters in base62 we will get ~3500 Billion URLs. Hence each of tiny url generated will have 7 characters.
How to get unique ‘7 character’ long random URLs in base62?
Once we have decided number of characters to use in Tiny URL (7 characters) and also the base to use (base 62 [0–9][a-z][A-Z] ), then the next challenge is how to generate unique URLs which are 7 characters long.
Technique 1 — Short url from random numbers:
We could just make a random choice for each character and check if this tiny url exists in DB or not. If it doesn’t exist return the tiny url else continue rolling/retrying.As more and more 7 characters short links are generated in Database, we would require 4 rolls before finding non-existing one short link which will slow down tiny url generation process.
Technique 2 — Short urls from base conversion:
Think of the seven-bit short url as a hexadecimal number (0–9, a-z, A-Z) (For e.g. aKc3K4b) . Each short url can be mapped to a decimal integer by using base conversion and vice versa.
How do we do the base conversion? This is easiest to show by an example.
Take the number 125 in base 10.
It has a 1 in the 100s place, a 2 in the 10s place, and a 5 in the 1s place. In general, the places in a base-10 number are:
The places in a base-62 number are:
- 62⁰
- 62¹
- 62²=3,844
- 62³=238,328
- etc.
So to convert 125 to base-62, we distribute that 125 across these base-62 “places”. The highest “place” that can take some is 62¹, which is 62. 125/62 is 2, with a remainder of 1. So we put a 2 in the 62’s place and a 1 in the 1’s place. So our answer is 21.
What about a higher number — say, 7,912?
Now we have enough to put something in the 3,844’s place (the 62²’s place). 7,912 / 3,844 is 2 with a remainder of 224. So we put a 2 in the 3,844’s place, and we distribute that remaining 224 across the remaining places — the 62’s place and the 1’s place. 224 / 62 is 3 with a remainder of 38. So we put a 3 in the 62’s place and a 38 in the 1’s place. We have this three-digit number: 23- 38.
Now, that “38” represents one numeral in our base-62 number. So we need to convert that 38 into a specific choice from our set of numerals: a-z, A-Z, and 0–9.
Let’s number each of our 62 numerals, like so:
0: 0,
1: 1,
2: 2,
3: 3,
...
10: a,
11: b,
12: c,
...
36: A,
37: B,
38: C,
...
61: Z
As you can see, our “38th” numeral is “C.” So we convert that 38 to a “C.” That gives us 23C.
So we can start with a counter (A Large number 100000000000 in base 10 which 1L9zO9O in base 62) and increment counter every-time we get request for new short url (100000000001, 100000000002, 100000000003 etc.) .This way we will always get a unique short url.
100000000000 (Base 10) ==> 1L9zO9O (Base 62)
Similarly, when we get tiny url link for redirection we can convert this base62 tiny url to a integer in base10
1L9zO9O (Base 62) ==>100000000000 (Base 10)
Technique 3 — MD5 hash:
The MD5 message-digest algorithm is a widely used hash function producing a 128-bit hash value(or 32 hexadecimal digits). We can use these 32 hexadecimal digit for generating 7 characters long tiny url.
- Encode the long URL using the MD5 algorithm and take only the first 7 characters to generate TinyURL.
- The first 7 characters could be the same for different long URLs so check the DB to verify that TinyURL is not used already
- Try next 7 characters of previous choice of 7 characters already exist in DB and continue until you find a unique value.
With all these shortening algorithms, let’s revisit our design goals!
- Being able to store a lot of short links (120 billion)
- Our TinyURL should be as short as possible (7 characters)
- Application should be resilient to load spikes (For both url redirections and short link generation)
- Following a short link should be fast.
All the above techniques we discussed above will help us in achieving goal (1) and (2). But will fail at step (3) and step (4). Let’s see how.
- A single web-server is a single point of failure (SPOF). If this web-server goes down, none of our users will be able to generate tiny urls/or access original (long) urls from tiny urls. This can be handled by adding more web-servers for redundancy and then bringing a load balancer in front but even with this design choice next challenge will come from database
- With database we have two options :
a. Relational databases (RDBMs) like MySQL and Postgres
b. “NoSQL”-style databases like BigTable and Cassandra
If we choose RDBMs as our database to store the data then it is efficient to check if an URL exists in database and handle concurrent writes. But RDBMs are difficult to scale (We will use RDBMS for scaling in one of our Technique and will see how to scale using RDBMS)
If we opt for “NOSQL”, we can leverage scaling power of “NOSQL”-style databases but these systems are eventually consistent (Unlike RDBMs which provides ACID consistency).
We can use putIfAbsent(TinyURL, long URL) or INSERT-IF-NOT-EXIST condition while inserting the tiny URL but this requires support from DB which is available in RDBMS but not in NoSQL. Data is eventually consistent in NoSQL so putIfAbsent feature support might not be available in the NoSQL database(We can handle this using some of the features of NOSQL which we have discussed later on in this article). This can cause consistency issue (Two different long URLs having the same tiny url).
Scaling Technique 1 — Short url from random numbers
We can use a relational database as our backend store but since we don’t have joins between objects and we require huge storage size (60TB) along with high writes (40 URL’s per seconds) and read (8000/s) speed, a NoSQL store (MongoDB, Cassandra etc.) will be better choice.
We can certainly scale using SQL (By using custom partitioning and replication which is by default available in MongoDB and Cassandra) but this difficult to develop and maintain.
Let’s discuss how to use MongoDB to scale database for shortening algorithm given in Technique — 1
MongoDB supports distributing data across multiple machines using shards. Since we have to support large data sets and high throughput, we can leverage sharding feature of MongoDB.
Once we generate 7 characters long tiny url, we can use this tinyURL as shard key and employ sharding strategy as hashed sharding. MongoDB automatically computes the hashes (Using tiny url ) when resolving queries. Applications do not need to compute hashes. Data distribution based on hashed values facilitates more even data distribution, especially in data sets where the shard key changes monotonically.
We can scale reads/writes by increasing number of shards for our collection containing tinyURL data(Schema having three fields Short Url,Original Url,UserId).
Schema for collection tiny URL :
{
 _id: <ObjectId102>,
 shortUrl: "https://tinyurl.com/3sh2ps6v",
 originalUrl: "https://medium.com/@sandeep4.verma",
 userId: "sandeepv",
}
Since MongoDB supports transaction for a single document, we can maintain consistency and because we are using hash based shard key, we can efficiently use putIfAbsent (As a hash will always be corresponding to a shard).
To speed up reads (checking whether a Short URL exists in DB or what is Original url corresponding to a short URL) we can create indexing on ShortURL.
We will also use cache to further speed up reads.
Scaling Technique 2 — Short urls from base conversion
We used a counter (A large number) and then converted it into a base62 7 character tinyURL.As counters always get incremented so we can get a new value for every new request (Thus we don’t need to worry about getting same tinyURL for different long/original urls).
Scaling with SQL sharding and auto increment
Sharding is a scale-out approach in which database tables are partitioned, and each partition is put on a separate RDBMS server. For SQL, this means each node has its own separate SQL RDBMS managing its own separate set of data partitions. This data separation allows the application to distribute queries across multiple servers simultaneously, creating parallelism and thus increasing the scale of that workload. However, this data and server separation also creates challenges, including sharding key choice, schema design, and application rewrites. Additional challenges of sharding MySQL include data maintenance, infrastructure maintenance, and business challenges.
Before an RDBMS can be sharded, several design decisions must be made. Each of these is critical to both the performance of the sharded array, as well as the flexibility of the implementation going forward. These design decisions include the following:
- Sharding key must be chosen.
- Schema changes.
- Mapping between sharding key, shards (databases), and physical servers.
We can use sharding key as auto-incrementing counter and divide them into ranges for example from 1 to 10M, server 2 ranges from 10M to 20M, and so on.
We can start the counter from 100000000000. So counter for each SQL database instance will be in range 100000000000+1 to 100000000000+10M , 100000000000+10M to 100000000000+20M and so on.
We can start with 100 database instances and as and when any instance reaches maximum limit (10M), we can stop saving objects there and spin up a new server instance. In case one instance is not available/or down or when we require high throughput for write we can spawn multiple new server instances.
Schema for collection tiny URL For RDBMS :
CREATE TABLE tinyUrl (
    id  BIGINT                 NOT NULL,  AUTO_INCREMENT
    shortUrl  VARCHAR(7)       NOT NULL,
    originalUrl  VARCHAR(400)  NOT NULL,
    userId   VARCHAR(50)       NOT NULL,
    automatically on primary-key column
                                           -- INDEX (shortUrl)
                                           -- INDEX (originalUrl)
);
Where to keep which information about active database instances?
We can use a distributed service Zookeeper to solve the various challenges of a distributed system like a race condition, deadlock, or particle failure of data. Zookeeper is basically a distributed coordination service that manages a large set of hosts. It keeps track of all the things such as the naming of the servers, active database servers, dead servers, configuration information (Which server is managing which range of counters)of all the hosts. It provides coordination and maintains the synchronization between the multiple servers.
How to check whether short URL is present in database or not?
When we get tiny url (For example 1L9zO9O) we can use base62ToBase10 function to get the counter value (100000000000). Once we have this values we can get which database this counter ranges belongs to from zookeeper(Let’s say it database instance 1 ) . Then we can send SQL query to this server (Select * from tinyUrl where id=10000000000111).This will provide us sql row data (*if present)
How to get original url corresponding to tiny url?
We can leverage the above solution to get back the sql row data. This data will have shortUrl, originalURL and userId.
Scaling Technique 3— MD5 hash
We can leverage the scaling Technique 1 (Using MongoDB). We can also use Cassandra in place of MongoDB. In Cassandra instead of using shard key we will use partition key to distribute our data.
Technique 4 — Key Generation Service (KGS)
We can have a standalone Key Generation Service (KGS) that generates random seven-letter strings beforehand and stores them in a database (let’s call it key-DB). Whenever we want to shorten a URL, we will take one of the already-generated keys and use it. This approach will make things quite simple and fast. Not only are we not encoding the URL, but we won’t have to worry about duplications or collisions. KGS will make sure all the keys inserted into key-DB are unique.
Can concurrency cause problems?
As soon as a key is used, it should be marked in the database to ensure that it is not used again. If there are multiple servers reading keys concurrently, we might get a scenario where two or more servers try to read the same key from the database. How can we solve this concurrency problem?
Servers can use KGS to read/mark keys in the database. KGS can use two tables to store keys: one for keys that are not used yet, and one for all the used keys. As soon as KGS gives keys to one of the servers, it can move them to the used keys table. KGS can always keep some keys in memory to quickly provide them whenever a server needs them.
For simplicity, as soon as KGS loads some keys in memory, it can move them to the used keys table. This ensures each server gets unique keys. If KGS dies before assigning all the loaded keys to some server, we will be wasting those keys–which could be acceptable, given the huge number of keys we have.
KGS also has to make sure not to give the same key to multiple servers. For that, it must synchronize (or get a lock on) the data structure holding the keys before removing keys from it and giving them to a server.
Isn’t KGS a single point of failure?
Yes, it is. To solve this, we can have a standby replica of KGS. Whenever the primary server dies, the standby server can take over to generate and provide keys.
Can each app server cache some keys from key-DB?
Yes, this can surely speed things up. Although, in this case, if the application server dies before consuming all the keys, we will end up losing those keys. This can be acceptable since we have 68B unique six-letter keys.
How would we perform a key lookup?
We can look up the key in our database to get the full URL. If its present in the DB, issue an “HTTP 302 Redirect” status back to the browser, passing the stored URL in the “Location” field of the request. If that key is not present in our system, issue an “HTTP 404 Not Found” status or redirect the user back to the homepage.
Should we impose size limits on custom aliases?
Our service supports custom aliases. Users can pick any ‘key’ they like, but providing a custom alias is not mandatory. However, it is reasonable (and often desirable) to impose a size limit on a custom alias to ensure we have a consistent URL database. Let’s assume users can specify a maximum of 16 characters per customer key.
Cache
We can cache URLs that are frequently accessed. We can use some off-the-shelf solution like Memcached, which can store full URLs with their respective hashes. Before hitting backend storage, the application servers can quickly check if the cache has the desired URL.
How much cache memory should we have?
We can start with 20% of daily traffic and, based on clients’ usage patterns, we can adjust how many cache servers we need. As estimated above, we need 70GB memory to cache 20% of daily traffic. Since a modern-day server can have 256GB memory, we can easily fit all the cache into one machine. Alternatively, we can use a couple of smaller servers to store all these hot URLs.
Which cache eviction policy would best fit our needs?
When the cache is full, and we want to replace a link with a newer/hotter URL, how would we choose? Least Recently Used (LRU) can be a reasonable policy for our system. Under this policy, we discard the least recently used URL first. We can use a Linked Hash Map or a similar data structure to store our URLs and Hashes, which will also keep track of the URLs that have been accessed recently.
To further increase the efficiency, we can replicate our caching servers to distribute the load between them.
How can each cache replica be updated?
Whenever there is a cache miss, our servers would be hitting a backend database. Whenever this happens, we can update the cache and pass the new entry to all the cache replicas. Each replica can update its cache by adding the new entry. If a replica already has that entry, it can simply ignore it.
Load Balancer (LB)
We can add a Load balancing layer at three places in our system:
- Between Clients and Application servers.
- Between Application Servers and database servers.
- Between Application Servers and Cache servers.
Initially, we could use a simple Round Robin approach that distributes incoming requests equally among backend servers. This LB is simple to implement and does not introduce any overhead. Another benefit of this approach is that if a server is dead, LB will take it out of the rotation and will stop sending any traffic to it.
A problem with Round Robin LB is that we don’t take the server load into consideration. If a server is overloaded or slow, the LB will not stop sending new requests to that server. To handle this, a more intelligent LB solution can be placed that periodically queries the backend server about its load and adjusts traffic based on that.
Customer provided tiny URLs
A customer can also provide a tiny url of his/her choice. We can allow customer to choose just alphanumerics and the “special characters” $-_.+!*’(),. in tiny url(With let’s say 8 minimum characters). When customer provides a custom url we can save it to some other instance of database (Different one from where system generates tiny url against original url) and treat these tiny URLs as special URLs. When we get redirection request we can divert these request to special instances of WebServer . Since this will be a paid service we can expect very few tiny URLs to be of this kind and we don’t need to worry about scaling WebServers/Database in this case.
Analytics
How many times has a short URL been used ? How should we store these statistics?
Since we used “HTTP 302 Redirect” status to the browser instead of “HTTP 301 Redirect”, thus each redirection for tiny url will reach service’s backend. We can push this data(tiny url, users etc.) to a Kafka queue and perform analytics in real time.
How does GCP support such a URL shortener service?
url-shortener is a small API that provides basic REST endpoints to shorten a URL, get information about the URL, update the URL, and get statistics on most accessed URLs.
The technology behind it:
- Golang 1.17
- Gin Web Framework
- Google Firestore
- Google PubSub
- Redis
- NanoID
- Swagger
Architecture
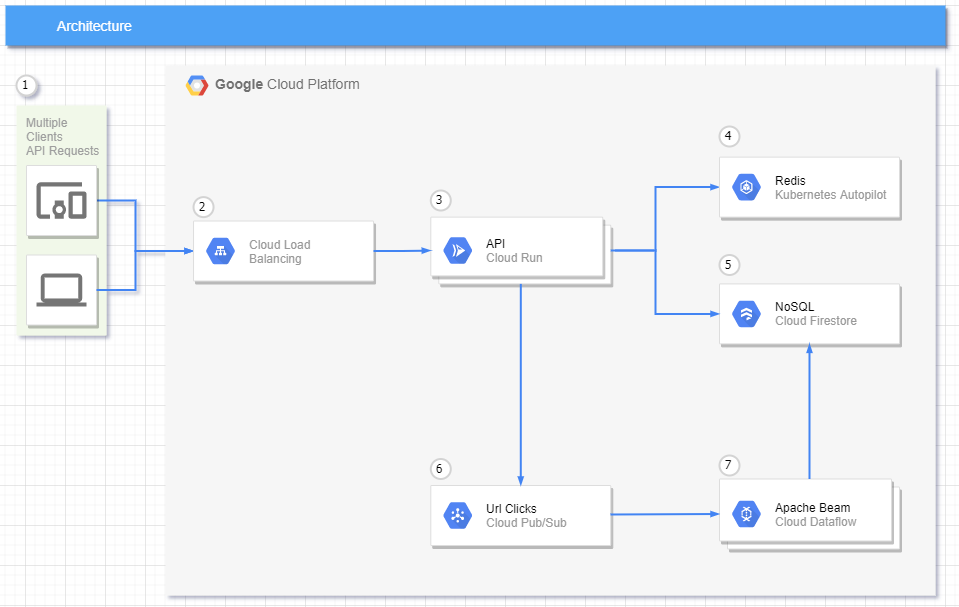
Written in Hexagonal Architecture
- Requests can come from many types of devices.
- Cloud Run is a fully managed serverless platform which already has an integrated load balance.
- Cloud Run will automatically scale to the number of container instances needed to handle all incoming requests.
- All request to get a URL will be checked in the cache first and any new URL that is generated will cached with a configurable TTL.
- All request to get a URL that is not found in the cache will be queried on the NoSQL and any new URL that is generated will be stored on the NoSQL.
- For each redirect request, a message will be sent to a pubsub topic to record that we had one more access.
- Here, we have an Apache Beam pipeline running in Dataflow, to group all messages by Id in a fixed time window, that will update the NoSQL database.
References:
- Geeks for Geeks
- Grokking the System Design Interview
- Learn how to implement a URL shortener using Go and GCP services
22 - V
Virtualization
Server consolidation is the most obvious, long-standing use case, but virtualization is like a Swiss army knife. You can use it in a number of different situations.
- Raghu Raghuram, CEO VMWare
The act of abstracting the underlying hardware to provide useful IT services to the end-user is called as virtualization. Also abbreviated as v12n, virtualization helps in full utilization of a machine’s capacity by distributing its capabilities across users and environments.
A common example of virtualization is a virtual machine where the hardware is abstracted from the user and multiple operating systems can be run on the same hardware. When we make use of Google Compute Engine, a new virtual machine is created on a remote server for our use. Thus, the server’s hardware is partitioned to provide some compute power to the customer.
Hypervisor

A hypervisor is software that creates and runs virtual machines (VMs). A hypervisor, sometimes called a virtual machine monitor (VMM), isolates the hypervisor operating system and resources from the virtual machines and enables the creation and management of those VMs.
The physical hardware, when used as a hypervisor, is called the host, while the many VMs that use its resources are guests.
The hypervisor treats resources—like CPU, memory, and storage—as a pool that can be easily reallocated between existing guests or to new virtual machines.
Multiple different operating systems can run alongside each other and share the same virtualized hardware resources with a hypervisor. This is a key benefit of virtualization. Without virtualization, you can only run 1 operating system on the hardware.
Virtualization v/s Containerization

At a high level, containers and VMs seem similar. They are both packaged computing environments that combine various IT components and isolate them from the rest of a system. The important distinction is in how they scale and their portability.
A container is a set of 1 or more processes that are isolated from the rest of the system. The container allows the process to access only the resource requests that have been specified. These resource limits ensure that the container is able to run on a node that has enough capacity.
VMs contain their own operating system (OS), allowing them to perform multiple resource-intensive functions at once. The increased resources available to VMs allow them to abstract, split, duplicate, and emulate entire servers, OSs, desktops, databases, and networks.
A hypervisor also allows you to run multiple operating systems in VMs, but containers are only able to run a single type of operating system. A container running on a Linux server, for example, is only able to run a Linux operating system.
Moreover, with a hypervisor, different kinds of virtualization can be implemented, such as:
Windows Subsystem For Linux 2 (WSL2) is a novel example of operating system virtualization by which Windows and a Linux-based OS can be used side-by-side in the Windows host operating system.
23 - W
WebAssembly (WASM)
The Dawn of a New Era!
WebAssembly is a new type of code that can be run in modern web browsers — it is a low-level assembly-like language with a compact binary format that runs with near-native performance and provides languages such as C/C++, C# and Rust with a compilation target so that they can run on the web. It is also designed to run alongside JavaScript, allowing both to work together.

WebAssembly has huge implications for the web platform — it provides a way to run code written in multiple languages on the web at near native speed, with client apps running on the web that previously couldn’t have done so.
WebAssembly is designed to complement and run alongside JavaScript — using the WebAssembly JavaScript APIs, you can load WebAssembly modules into a JavaScript app and share functionality between the two. This allows you to take advantage of WebAssembly’s performance and power and JavaScript’s expressiveness and flexibility in the same apps, even if you don’t know how to write WebAssembly code.
How WASM Works?

Wasm programs are deployed in two stages. First, a Wasm module is generated from the source code:
-
Write the application in your preferred language.
-
Create a pre-compiled Wasm module.
-
Distribute the module—ideally, using a CDN for low latency.
Once the Wasm module is built, it can be run anywhere with a few lines of JavaScript glue:
Compilation
You can write a Wasm module in any language that supports it or in the text assembly directly. For instance, take this C file called answer.c:
int answer() {
 return 42;
}
To generate a standalone .wasm module, you can use emscripten. Emscripten is a C and C++ compiler that generates JavaScript files and WebAssembly binaries:
emcc answer.c -O2 -s SIDE_MODULE=1 -o answer.wasm
The result of the compilation is a file called answer.wasm. This file can now be loaded in a browser, as a server component.
For the most part, emscripten’s emcc can be used as a drop-in replacement for GNU’s gcc. Therefore, it can compile any portable C or C++ library and bring it to the Web.
Running in the browser
To run a Wasm module in the browser, the .wasm file must be loaded, instantiated, and invoked. You can choose among the multiple loading methods described in the JavaScript API.
For example, this script loads answer.wasm in the browser and shows the output (the number “42”) in an alert box:
fetch('answer.wasm').then(response =>
 response.arrayBuffer())
 .then(bytes =>
 WebAssembly.instantiate(bytes))
 .then(result =>
 alert(result.instance.exports.answer()));
Running outside the browser
The primary motivation behind WebAssembly was to enable developers to run advanced applications in browsers. Nevertheless, nothing prevents you from running Wasm modules on servers.
For instance, you can run answer.wasm in Node.JS with just a few lines of code:
const fs = require('fs');
const run = async () => {
 const buffer = fs.readFileSync("./answer.wasm");
 const result = await WebAssembly.instantiate(buffer);
 console.log(result.instance.exports.answer());
};
run();
Examples of WebAssembly
WebAssembly programs can go where no JavaScript has gone before, namely media edition, image recognition, transcoding, VR and high-end games, emulation, or desktop-tier applications.
More use cases include:
- Recording and encoding audio.
- Encoding video.
- Rendering 3d objects in real time.
- Re-encoding images on the fly.
- Editing and annotating PDFs.
- Createing a fully featured text editor.
- Visualizing data in real time.
- Doing real time physics simulation.
WebAssembly has been successfully deployed in the real world, too:
- eBay implemented a universal barcode scanner.
- Google Earth can run in any browser now, thanks to WebAssembly.
- The Unity and the Unreal game engines have been ported to WebAssembly. You can even run the Unreal Epic Zen Garden demo.
- The Doom 3 engine has also been ported to WebAssembly. You can play the demo online.
- Alternatively, you can create custom games in the browser with Construct3.
Key Takeaways
- With around 40 languages that can compile to WebAssembly, developers can finally use their favorite language on the Web.
- WebAssembly does not replace JavaScript; in fact, some JavaScript code is required to load WebAssembly modules.
- WebAssembly runs in all major browsers and in all platforms. Developers can reasonably assume WebAssembly support is anywhere JavaScript is available.
- WebAssembly can also run in servers.
24 - X
XaaS
The persuasive wave of cloud computing is affecting every industry and every vertical we can think of. Thanks to all of its fundamental models — IaaS, PaaS, and SaaS plus the latest XaaS, cloud has brought in democratization of infrastructure for businesses. Talking about XaaS. It is the new hulk of the cloud computing and is ushering in more of ready-made, do-it-yourself components and drag-and-drop development.
- Amarkant Singh, Head of Product, Botmetric.
What is XaaS?
“Anything-as-a-service” also referred to as “Everything-as-a-Service” (XaaS) describes a general category of services related to cloud computing and remote access. It recognizes the vast number of products, tools, and technologies that are now delivered to users as a service over the internet. Essentially, any IT function can be transformed into a service for enterprise consumption. The service is paid for in a flexible consumption model rather than as an upfront purchase or license.
It is an extremely wide-ranging term that refers to any tools, applications, services, games, etc., which are delivered to your laptop or other device via the cloud, rather than obtained on-premises or in a physical format.
The XaaS model was born as a result of the elasticity that the cloud offers. More so, the XaaS provides an ever-increasing range of solutions that ultimately gives businesses the extreme flexibility to choose exactly what they want tailored for their business, irrespective of size/vertical.
A XaaS platform eliminates the need to worry about building out extensive on-premise storage, web services, hardware, or custom software. It depends on what service the specific XaaS company is offering.
Instead of building everything in-house, companies can purchase a XaaS product license for an extended period and take advantage of its extensive infrastructure.
Examples of XaaS
A few examples of XaaS include:
-
Infrastructure-as-a-service (IaaS)
-
Platform-as-a-Service (PaaS)
-
Function-as-a-Service (FaaS)
-
Software as a Service (SaaS)
SaaS stands for “Software as a Service,” and it is the most common type of XaaS business. In this version, a provider hosts applications and software in the cloud and then offers them to consumers on a subscription basis. Cloud users do not manage the cloud infrastructure and platform where the application runs. This eliminates the need to install and run the application on the cloud user’s own computers, which simplifies maintenance and support.
You probably use or have used Gmail, Google Docs, Salesforce, Showpad,… before. It is actually Software running in the cloud. These SaaS-product all run in the cloud so you can open them anywhere you are and you never need to install them.
-
Disaster-Recovery-as-a-Service (DRaaS)
This complex service includes backup, recovery system tools, and full replication of all of the data, apps, and business processes. Actually, DRaaS clones the main infrastructure, and continuously updates it. In the case of a failure or disaster, the company’s work will continue in this additional infrastructure until the main system is restored. DRaaS is one of the main components of a business continuity strategy — BCM, Business Continuity Management.
Creating a redundant, fault-tolerant clone of the main infrastructure is a huge cost, unbearable for most companies. At the same time, cloud-based DRaaS is much more convenient, accessible, and provides additional protection delivered by the cloud provider.
-
Communication-as-a-Service (CaaS)
This is a comprehensive SaaS-solution for providing communication services in the company, including Internet telephony, video calls, chats, and instant messengers, interfaces for working with documents, and other communication tools. Using this cloud software solution allows you to significantly save on infrastructure and software, while you can scale capacity, as is usually the case in cloud solutions.
-
Network-as-a-Service (NaaS)
NaaS is a cloud model that enables users to easily operate the network and achieve the outcomes they expect from it without owning, building, or maintaining their own infrastructure.
NaaS can replace hardware-centric VPNs, load balancers, firewall appliances, and Multiprotocol Label Switching (MPLS) connections. Users can scale up and down as demand changes, rapidly deploy services, and eliminate hardware costs.
-
Database-as-a-Service (DBaaS)
DBaaS solutions enable businesses to organize, filter, and store customer data in software easily accessed and retrieved by the right employee.
Companies using DBaaS software won’t have to build their database from scratch. Instead, they can customize and create a personalized database in the cloud using a trusted DBaaS solution.
An example of a DBaaS product is Oracle Database.
-
Desktop-as-a-Service (DaaS)
This is a service that allows you to organize terminal access to a remote server using thin clients and the RDP protocol. When corporations realized that maintaining a fleet of personal computers, especially in companies with a multidivisional structure, was very expensive in all respects (maintenance, support, spare parts and components, IT staff), they began to look for optimization. But cloud technology solves this issue. Organizing a remote connection of tens and even hundreds of workstations to a terminal server using Desktop-as-a-Service is easy, flexible, economical, and very convenient.
-
Healthcare-as-a-Service (HaaS)
With electronic medical records (EMR) and hospital information systems (HIS), the healthcare industry is transforming into Healthcare-as-a-Service. Medical treatment is becoming more data-driven and patient-centric. Thanks to the IoT, wearables and other emerging technologies, the following services are available:
- Online consultations with doctors
- Health monitoring 24/7
- Medicine delivery at your doorstep
- Lab samples collection even at home and delivery of results as soon as they are ready
- Access to your medical records 24/7
HaaS creates opportunities for almost all categories of citizens to get qualified medical help.
-
Transportation-as-a-Service (TaaS)
Important trends of modern society are mobility and freedom of transportation at different distances. There are numerous apps popping up connected with transport, so a part of this industry is transforming into an -aaS model. The most vivid examples are:
- Carsharing (you can rent a car at any place via a special app and drive anywhere you need, paying for the time you use a car, or for the distance you cover)
- Uber taxi services (you order a taxi via an app, which calculates the cost of the rout in advance).
-
Storage-as-a-Service (STaaS)
Storage as a Service (STaaS) is the practice of using public cloud storage resources to store your data. Using STaaS is more cost efficient than building private storage infrastructure, especially when you can match data types to cloud storage offerings.
-
Backend-as-a-Service (BaaS)
Backend-as-a-Service (BaaS) is a cloud service model in which developers outsource all the behind-the-scenes aspects of a web or mobile application so that they only have to write and maintain the frontend. BaaS vendors provide pre-written software for activities that take place on servers, such as user authentication, database management, remote updating, and push notifications (for mobile apps), as well as cloud storage and hosting. Firebase is a cost-effective BaaS platform.
-
Malware-as-a-Service (MaaS)
Well, speaking about XaaS, we usually mean products oriented solely to achieve legitimate goals by law-abiding citizens. But life gives a chance to everyone, without exception. And if there is a demand for cyber attacks, industrial espionage, confidential information leaks, there will be those who create tools for such actions. Why can’t software be developed to create viruses, worms, and trojans? And maybe it’s underway. And such “factories of malicious software” work on cloud servers, and interact with clients according to the SaaS model. Malware-as-a-Service products allow attackers to attack their victims, including through botnets that MaaS customers gain access to as part of the service.
Benefits of XaaS
The market of services provided via cloud computing and the Internet is expanding at a rapid pace due to a range of advantages they provide both for organizations and end-users. The biggest benefits are:
- Scalability
Outsourcing provides access to unlimited computing capacities, storage space, RAM, etc; a company can quickly and seamlessly scale its processes up and down depending on requirements and doesn’t have to worry about additional deployments or downtimes.
- Cost and time effectiveness
A company doesn’t purchase its personal equipment and doesn’t need to deploy it, saving much time and money; a pay-as-you-go model is also beneficial.
- Focus on core competencies
There’s no need to set up apps and programs or conduct training for employees; consequently, they can concentrate on their direct duties and achieve better performance.
- Growth
By reducing capital expenditure and enabling simple scalability, XaaS enables owners and managers to grow their business. With XaaS, owners will find it easier to identify and access the right technology and allow their salesforce to chase new business that may have been beyond their potential capacity.
- Better Security
It contains improved security controls and configured to exact requirements of business.
- The high quality of services
Since professionals support and maintain your infrastructure and systems, they provide the latest updates and all the emerging technologies, guaranteeing the quality of services.
- Better customer experience
The above-mentioned pros lead to customer satisfaction and increase customer loyalty.
Disadvantages of XaaS
So far, it all sounds perfect, but as with any process or system, there are some potential disadvantages to XaaS.
- Downtime
We have all experienced some level of internet downtime and, even with XaaS, this is a potential issue that may arise. If your XaaS provider’s servers go down then that will also affect you. Some XaaS providers may guarantee services through a service level agreement (SLA).
- Performance
XaaS is becoming increasingly more popular and, as that happens, there can be issues with latency, functionality, bandwidth, etc. If you are running apps within a virtual environment, especially a public cloud environment, then they may also be affected.
- Integration
As digital transformation speeds up and we move to increased levels of automation, there may also be some issues with integration – especially if your business is working across more than one cloud service.
- Troubleshooting
While shifting many of your business components to XaaS relieves your own staff of many of their regular tasks, if issues do arise then it may be harder for your IT staff to troubleshoot the problem. Provisioning for those staff to stay up to date in the technology may lessen any impact.
25 - Y
YAML
The superset of JSON
YAML is a data-serialization language that is commonly used to define configuration files for Ansible, Kubernetes, GitHub Actions and many more DevOps tools. Originally intended to be called Yet Another Markup Language to reference its purpose as a markup language like HTML, XML in the early 00’s, YAML is now repurposed as YAML Ain’t Markup Language to indicate its data representation purpose.
Why YAML?
We usually use JSON for defining configurations for web applications such as a package.json for Node.js applications. However, YAML is widely seen in use for defining configurations for larger applications. YAML supports several features that are absent in JSON such as it is more human-readable, supports comments, multiple data types, and multiline strings.
An Example
The structure of a YAML file is a map or a list. Maps allow you to associate key-value pairs. Each key must be unique, and the order doesn’t matter; you can relate to a Python dictionary.
A map in YAML needs to be resolved before it can be closed, and a new map is created. A new map can be created by either increasing the indentation level (usually 2 spaces) or by resolving the previous map and starting an adjacent map.
A list includes values listed in a specific order and may contain any number of items needed. A list sequence starts with a dash (-) and a space, while indentation separates it from the parent. You can think of a sequence as a Python list or an array in Bash. A list can be embedded into a map.
# an example YAML
author: "Pankaj Khushalani"
day: Y # strings work without quotes too
number: 25
number-as-hex: 0x19
is-about-yaml: true
sections-array:
  - "Why YAML"
  - "An Example"
  - "Learn More"
sections-array-another-way: ["Why YAML", "An Example", "Learn More"]
dictionary:
  dictionary-key: four
  dictionary-in-dictionary:
    nested-dictionary-key: 1
multiline-string: |
  I can write this string
  across multiple lines :)
The following is the corresponding JSON obtained from a YAML to JSON convertor:
{
  "author": "Pankaj Khushalani",
  "day": "Y",
  "number": 25,
  "number-as-hex": 25,
  "is-about-yaml": true,
  "sections-array": [
    "Why YAML",
    "An Example",
    "Learn More"
  ],
  "sections-array-another-way": [
    "Why YAML",
    "An Example",
    "Learn More"
  ],
  "dictionary": {
    "dictionary-key": "four",
    "dictionary-in-dictionary": {
      "nested-dictionary-key": 1
    }
  },
  "multiline-string": "I can write this string\nacross multiple lines :)\n"
}
As we can see, double quotes were added everywhere, comments were removed, and escape sequences were used for multiline strings. Because of its support for lists and maps in YAML, a JSON file is a valid YAML file.
Learn More
26 - Z
Zero Client
Not every system needs its own dedicated OS, Databases, Processors.
Zero client, also known as ultrathin client, is a server-based computing model in which the end user’s computing device has no local storage.
A typical zero client product is a small box that serves to connect a keyboard, mouse, monitor and Ethernet connection to a remote server. The server, which hosts the client’s operating system (OS) and software applications, can be accessed wirelessly or with cable. Basically, they are bare-bones computers that rely on a server to handle many functions that a traditional PC, or thick client, would normally handle using its own hardware and software.
Zero clients are often used in a virtual desktop infrastructure (VDI) environment. This makes them ideal for remote work situations or distributed work environments.
How do zero clients work?

Zero clients are essentially input/output (I/O) redirection units. All user inputs (mouse clicks, keystrokes, etc.) are sent to a remote server, which returns data to display on a connected monitor. This is where the name “zero client” comes from – almost all processing takes place on the server side, and almost zero processing takes place client-side.
Zero clients don’t use an operating system and instead use firmware to connect to a remote device. An onboard processer is designed to use a sole protocol to communicate with a remote server – usually PCoIP protocol to connect with the device. Firmware can be altered to support a different sole protocol, such as Microsoft RDP or Citrix HDX, but can only generally be optimized for one protocol at a time.
No data is stored on zero clients, because there is no local storage. Therefore all applications are provisioned and managed on a server in a remote data center, and served to the zero client device using its protocol.
Zero client hardware specifications
Zero clients are often physically small pieces of hardware – meaning they have a small form factor. They are generally not more than a foot tall, around two inches wide, and weigh approximately two pounds. They typically include a processor with basic firmware installed on it, and some combination of ports including HDMI, DVI, DisplayPort, USB and Ethernet. There is also a port for a power supply.
Zero clients also tend to have line out and mic in ports, and usually also support wireless and VESA mounting. Some zero clients support multiple monitors.
Benefits of zero client devices
-
Power usage can be as low as 1/50thof fat client requirements.
-
Devices are much less expensive than PCs or thin clients.
-
Efficient and secure means of delivering applications to end users.
-
No software at the client means that there is no vulnerability to malware.
-
Easy administration.
-
In a virtual desktop environment, administrators can reduce the number of physical PCs or blades and run multiple virtual PCs on server-class hardware.
-
Improved user experience stemming from increased hardware efficiency.

Drawbacks of zero client devices
-
They often have limited ability to render graphics.
-
Performance depends on network connection because they rely on remote servers to do almost all processing.
-
Many zero clients are optimized for only one vendor or connection broker. Some may be reconfigured, but at best this is an inconvenience and at worst it leads to vendor lock-in.
Popular vendors of zero client
-
Digi International Inc.
-
Teradici Corporation
-
Via Labs
-
Dell Wyse
Learn
Learn more about zero client.